The final days of the year are always a great time to sit back and reflect on the last 12 months. For us at ChartMogul, it is also a tradition. (See reviews for 2018, 2017, and 2016.)
I am really proud to once again be able to say that 2019 was the best year for ChartMogul up to date.
That wouldn’t have been possible without the contribution of the whole team and, of course, without the continued support of our customers.
Let’s look at some of the defining moments over the last 4 quarters.
Q1 (January-March)
We started the year on a high note by releasing our revamped Customer Lists functionality. With this update, we made customer lists — already one of the most popular features with our customers — customizable, savable, and shareable.
One of the most common things we hear from customers is that ChartMogul allows them to develop deep insight into their business — who their customers are, where they come from, and so on. With this update, you will find it even easier to develop that knowledge and share it across your team.
In February we headed to San Jose to attend SaaStr Annual. During the conference, we also sponsored a happy hour for our customers, partners, and friends.
The main goal of these events is not to generate new leads (although that happens too), but to meet and learn directly from the people who use our product on a daily basis. This helps us bring the voice of the customer internally on the team.
The first 3 months of the year were also an active time for our blog.
We published Kristen LaFrance’s guest post on 5 non-obvious reasons why your customers are churning and a case study on how the Instapage team uses ChartMogul to go after bigger customers.
We also updated our popular SaaS Metrics Refresher email course.
Q2 (April-June)
In April, we picked up where we left off in Q1 and launched our native integration with Google Play.
After enabling our customers to bring in data from the App Store, the Google Play integration completed our mobile analytics suite and allowed customers running mobile apps to get a complete picture of their business.
(Later in the year we spoke to brands like Contacts+ and Meditopia who take full advantage of these developments.)
The second quarter of the year was a busy time for our content and creative teams as well.
To close the loop on the mobile front, we published the Mobile Analytics Cheat Sheet.

Our SaaS Resources library grew with another piece of content when we added The Ultimate Failed Payments Cheat Sheet to the collection.
The period between the beginning of April and the end of June was also the time when we published some of the most popular blog posts of 2019:
- The SaaS Guide to Website Personalization
- 🐻 Find out Which Animal(s) You’re Hunting
- How We Run Finance & Operations with Two People at ChartMogul
Q3 (July-September)
On the product side, the third quarter of 2019 saw the launch of two important enhancements. We started supporting Multicomponent Subscriptions (for customers bringing data from Stripe) and launched our Smart Activity Classification feature, which allows users to control how multiple movements are recognized in their ChartMogul accounts.
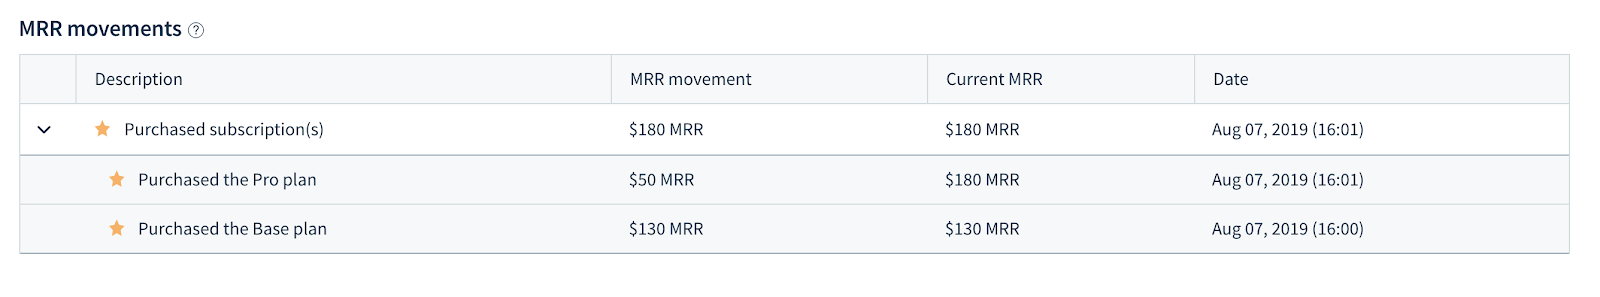
These changes look minor on the surface, but they allow you to track and assign MRR movements to customers with great accuracy, making ChartMogul the single source of truth when it comes to your subscription metrics.
In August our team headed for Edinburgh for Turing Fest where we sponsored a booth. This was a great opportunity to get out of our comfort zone (SaaS) and meet customers and leaders from all corners of the tech industry.
After coming back from Scotland, Sara, our Director of Marketing and Sales, wrote this great post on how startups should build and run an early sales team.
Around that time, we also started publishing guides on how subscription companies should think about some of their key metrics:
- The Full Guide to ARPU for SaaS Companies
- Customer Acquisition Cost: The Secret Weapon of Successful Startups
Q4 (October-December)
October started on a high note for us — ChartMogul turned 5! I shared my reflections on the event in a blog post, but apart from the birth of my daughter, this company has been the most transformational event in my life.
The month of October is 2 times special for our team because it’s also the month when we attend and sponsor SaaStock Dublin.
This year we went in full force — we brought 8 people from the team to Dublin where we talked to customers, learned a ton, and had a lot of fun.

I also gave an interview for Intercom’s podcast and spoke on a panel on how we operate as a remote company.
A busy Q4 didn’t mean we stopped working on improving ChartMogul. At the end of October, we added support for signing up and logging in to ChartMogul using a Google account.
We also ran a bunch of partnerships on the content side:
- Aazar Ali Shad from Userpilot published an article about combining sales and product-led growth.
- We teamed up with Spendesk, Teamwork, and Process Street to deliver a webinar on automating business ops in 2020.
Finally, we wrapped up the quarter (and the year) with a team offsite on the beautiful Spanish island of Mallorca where we talked about where we want to take ChartMogul in 2020.
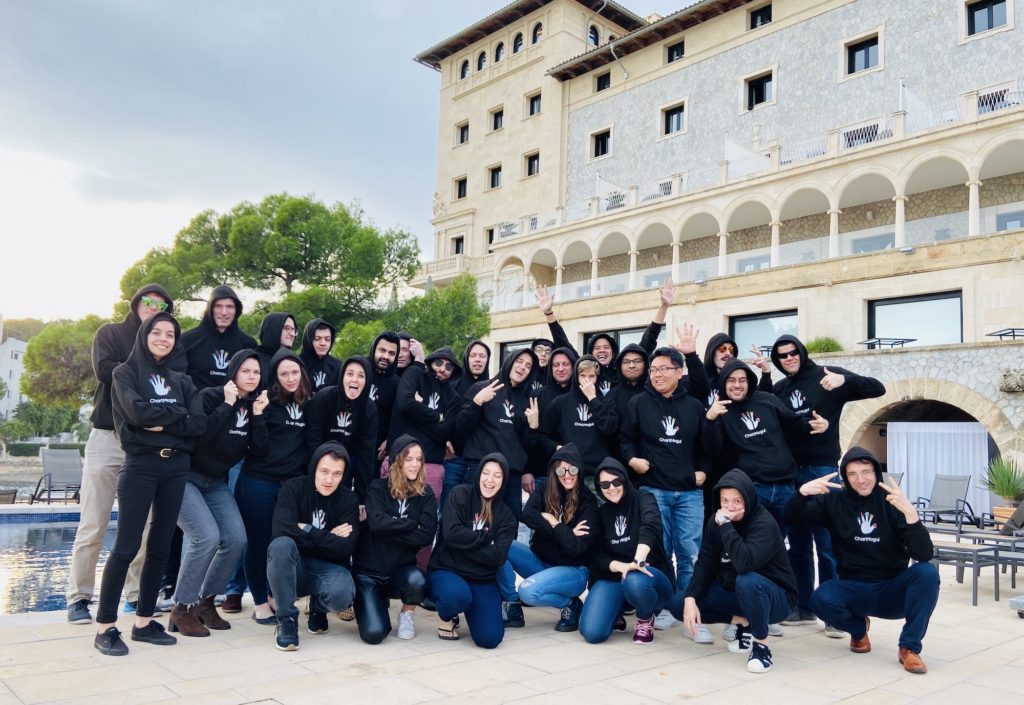
We might have also spent a beautiful sunny day on a boat…
Putting the whole of 2019 in perspective
All in all, our biggest focus this year was on making ChartMogul a better product on all sides.
We pushed dozens of under-the-hood enhancements that improve the performance, accuracy, reliability, security of our platform.
I outlined some of the biggest improvements we made over the year, but you can see a detailed list of every change in the release notes that we publish regularly.
At the time of writing this (in mid-December), we’ve closed 8,143 tickets from customers with an average first reply time of 32 minutes during business hours (Mon-Fri, 9 am to 11 pm CET) and an average satisfaction rating of 96%.
We published 41 articles (including 5 customer stories) on the blog and several resources for SaaS companies.
Where it comes to general trends, we’ve noticed that our audience is really interested in how data — about customers, payments, and so on — can be collected and used to improve and grow subscription businesses.
Finally, I want to thank those responsible for making 2019 such a great year for ChartMogul.
First, it’s the team who’ve stuck with us through thick and thin and are the power behind all the great results I listed above. I am thankful for your hard work and dedication and I hope you feel challenged, but that you also have fun while building ChartMogul.
I kept the last piece of gratitude for those who are ultimately responsible for every bit of ChartMogul’s success — our customers.
Thank you for being with us for the last 5 years!
We have great things in store for you for 2020 and I am really excited to share them with you in the near future.