
ACV isn’t the first thing you cross out when you play SaaS Metrics Bingo (no, it doesn’t exist yes, it does — we made it).
Nevertheless, it is still a useful way to assess the performance of your commercial team, especially when you employ a sales motion to grow your company.
Unfortunately, many founders still don’t know how to take full advantage of it — either because they’re not sure they’re calculating it in the most accurate way, or because they don’t know how to use the numbers in a meaningful and actionable way.
With this guide, we want to help founders, CEOs, and revenue and marketing leaders learn how to measure and use one of the most important commercial metrics.
What is ACV?
Annual contract value (or ACV) measures the total revenue a customer generates for your company on an annual basis.
What that means is that ACV is calculated slightly differently when you’re comparing contracts that span just one, multiple, or partial years.
Contracts that last longer than 1 year should be normalized (divided) to show their annual value. Partial year contracts should not be inflated to their annual value.
We’ll look at a few examples in the next section to add more color to this distinction.
How is ACV calculated?
We’ll look at 3 examples to demonstrate how ACV is calculated in each of the cases I described above:
- Delos Inc. signs a 12-month contract worth $3,000.
- Pied Piper Inc. commits to a 36-month contract worth $6,000 in total.
- ACME Inc. signs a 6-month contract at a total value of $2,000.
In the case of Delos, calculating the ACV is as straightforward as it looks:
ACV = $3,000
In cases where you have contracts that are longer than a year, you have to normalize (or divide) the value of the contract over its duration, for example with Pied Piper, it would look like this:
ACV = $6,000 / (36/12) = $6,000 / 3 years = $2,000
Finally, for ACME, you’re not going to mark up their contract to a (hypothetical) full year, because they’ve only committed to paying for your services for 6 months. That means their ACV is only the amount they’ve committed to:
ACV = $2,000
Individual ACV stats are useful when you’re analyzing your customers, but it’s also useful to average the score across your whole customer base to understand who you’re selling to and how your team is performing.
To that end, you’d have to find your average ACV (we’ll use the same example from above):
$3,000 + $2,000 + $2,000 = $7,000 / 3 = $2,333
You can use the same approach to segment your ACV by channel (self-service, sales assisted, etc.) or by geography (North America vs. APAC vs. EMEA for example) to find out where the biggest deals are and where your sales team performs the best.
This information can be valuable to understand what customers are open to committing to longer deals and what you need to do to close them.
ACV vs. ARR (Annual Run Rate)
The similarity (and differences) between ACV and ARR cause a lot of confusion even to experienced operators who are familiar with SaaS metrics.
In our guide on MRR, we defined ARR as a forward-looking metric that expands 12 months into the future from the current point of time. So, essentially, the calculation looks like this:
ARR = 12 x MRR
To go back to our example, if we take the MRR for each of the 3 customers above, we get something like this:
Delos = $3,000 / 12 = $250
Pied Piper = $6,000 / 36 = $167
ACME = $2,000 / 6 = $333
Therefore (provided you have no other customers):
MRR = $250 + $167 + $333 = $750 and ARR = $750 x 12 = $9,000
However, if we combine the ACVs of the 3 customers that we calculated above, we get a total ACV of (only) $7,000.
The reason for this discrepancy is that we count ACME towards ARR as if they’ve signed on an annual contract. Unless they’ve clearly expressed their intent to churn at the end of their 6-month contract, the best practice for subscription revenue is to count it as ongoing.
So, we haven’t made a mistake — which comes to show us that there’s a subtle, but important difference between ACV and ARR and that both have their place in your analytics arsenal.
ACV vs. TCV (Total Contract Value)
Confused, yet?
No worries, you’re not alone.
On top of Annual contract value, you also have Total contract value or TCV.
In our example, the TCV is just the total revenue each customer has committed to pay you over their contract, so:
- Delos: $3,000
- Pied Piper: $6,000
- ACME: $2,000
Most teams prefer ACV because it gives you an apples-to-apples comparison — you know which customers deliver the most revenue on an annualized basis, so you can focus on keeping the existing ones and attracting more of the same type.
But sometimes looking at TCV can also be beneficial. For example, you can use it when deciding how much effort should go into keeping/attracting a specific customer — one with a large TCV might merit a bigger discount, more marketing and sales budget spent on attracting them, etc.
How to use ACV?
ACV is most popular with sales teams, but it can help you find the answers to important strategic questions as well. Here are some ideas on how you can use it.
Guide your strategy
What’s a typical ACV? is a question that often pops up in discussions about the metric.
It is natural to think that it’s always better to aim for high ACV, but it doesn’t have to be the case. There’s plenty of companies — especially those selling to consumers — who are profitable on a low ACV. Companies like Spotify and Netflix manage to rake in billions in revenue on ACVs that are lower than $200.
We often like to refer to Christoph Janz’s concept that he calls “5 ways to reach 100 million”:
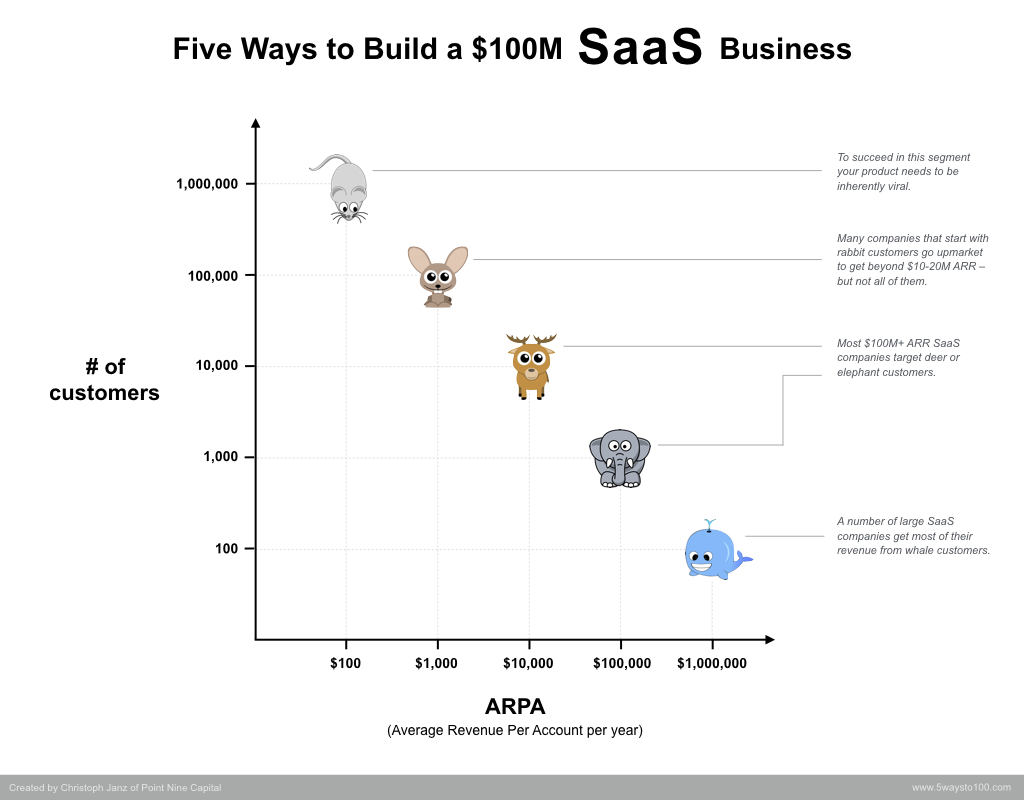
Looking at your ACV allows you to understand how many customers you need to get to hit your next target (1m, 10m, 100m in ARR).
Additionally, by tracking your average annual contract closely you can also understand how effective your sales and marketing efforts are.
Make sense of your commercial program
How do you describe your sales program?
For Sara Archer, our Director of Sales, it’s about 2 things:
- how long the sales cycle is and
- the size of the average deal (i.e. ACV).
If you’re interviewing for a position within sales, this gives you enough information to know what to expect in terms of the customers you’ll be talking to — how sophisticated they are, how many people participate in the decision, and what kind of service they would expect.
By comparing ACV (individual or average/weighted) against CAC — the cost of acquiring said (group of) customer(s) — you can also understand whether your sales and marketing efforts are profitable or putting a dent in your company’s finances.
Don’t be intimidated by ACV
Dealing with ACV can be challenging at first, but get the basics right and you will know where you stand and what to do with it.
This is the action plan you need to follow to make ACV your ally:
- Learn how to calculate ACV for individual customers/contracts. That gives you a solid basis to compare different customers.
- Learn how to find the average ACV for your whole customer base or by segment. Look at it in various ways — by channel/motion (sales vs. self-service, by salesperson, etc.)
- Compare your ACV vs. other key metrics — CAC (again, by segment) and others — to understand the effectiveness of your sales and marketing programs.
Measuring ACV accurately is the basis of any high-performing sales team. Do not overlook it.