
A necessary disambiguation between two valuable — and very different — forms of business intelligence. Reporting and analytics are often used interchangeably these days—incorrectly so.
Many businesses choose to label their reporting as analytics—we put that down to the added flair implied by the fancier word choice. We get it—analytics does sound more sophisticated.
That’s because it is.
Reporting is sharing information, analytics is investigating it.
Now, by no means are we saying that reporting is dead—it’s very much alive and well, and remains to be a fundamental and important part of SaaS. What we’re saying is that reporting and analytics correspond to two different functions, which provide different value and play unique roles in your business growth.
To confuse the terms is to lose the crucial distinction between measuring your performance and investigating your performance—a business intelligence mistake you don’t want to make.
TL;DR
- Reporting and analytics both serve important, but different, functions in your business growth.
- Reporting raises questions, and analytics focuses on interpreting data to answer them.
- Analytics can be descriptive, diagnostic, predictive, and prescriptive—each answers a different question and uncover different insights.
- Analytics are only helpful if you take action following investigation.
First thing’s first, let’s set the record straight on what exactly we mean with the terms ‘report’ and ‘analytics’. We spoke to Nick, CEO at ChartMogul for industry-approved definitions.
What is a report?
“A report is a document that presents information in an organized format. For example, a report to your investors will include reports on revenue and growth.”
Reporting on your core SaaS metrics and presenting them—be it via an email, a slidedeck, or another tool—falls under this category.
What is analytics?
“Analytics is the process of discovering, interpreting, and communicating significant patterns in data.”
Revenue analytics involves diving deeper into your raw to understand the why behind your core SaaS metrics.This enables you to make better business decisions.
ChartMogul support businesses when it comes to both reporting and analytics. The sleek charts and graphs make visualizing and sharing your business reporting quick and easy, while the ample analytics features enable you to dive deeper and find your why.
Reporting vs analytics: what’s the difference
Reporting provides you with information, analytics give you insights. Reporting raises questions, and analytics focuses on interpreting data to answer them.
Both are valuable, but for different purposes.
What’s so special about analytics?
Analytics explains the “why?” and the “so what?”
How? Because it’s dynamic—on more than just a scale of time or interval. You should be able to contort data points to whatever you need. If what you see is a set of standard metrics, then it isn’t truly an analytic assessment—or an analytics product.
From this dynamic investigation into the data, you can derive actionable recommendations about your business. What should you change about your practices to improve your core metrics?
Once you’ve got your insight-driven next steps—it’s essential you take action. Otherwise, the value of analytics is entirely foregone. Self-service analytics are enabling companies to track and analyze data from the get-go, and seamlessly scale with growing data needs.
For example, we see SaaS companies adopt more self-service analytics tools as their data efforts evolve and increase.
As the organization grows, they need deeper insights—which they obtain through adding and integrating specialized tools. It’s only when businesses have more sophisticated data science needs that they begin to questions whether to build or buy analytics tools, At this point, they’re ready to move on to building data teams capable of managing and analyzing large sets of data.
That’s often after years of operations, however, self-serve analytics tools typically suffice for SaaS companies looking to understand business intelligence.
Now, time to don our data analyst hat and look at how both analytics and reporting can be visually presented.
How are reports presented visually?
Let’s use Monthly Recurring Revenue as an example.
Here is how MRR is typically reported. This chart shows the MRR for the last year, marked monthly. The organization is well on its way towards the $3M+ ARR mark, but wants to dig deeper to understand how to ensure they hit that mark.
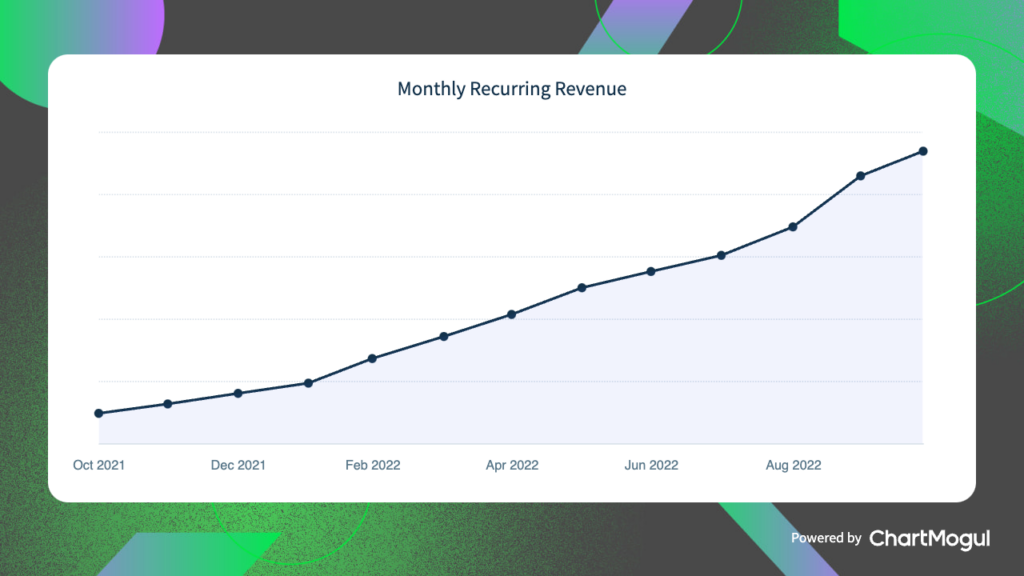
This chart displays the fluctuations in MRR but doesn’t necessarily provide any information on why. If you want to analyze your MRR, you can play with the parameters and drill into different nooks and crannies of the data—that’s where analytics comes in.
How are analytics presented visually?
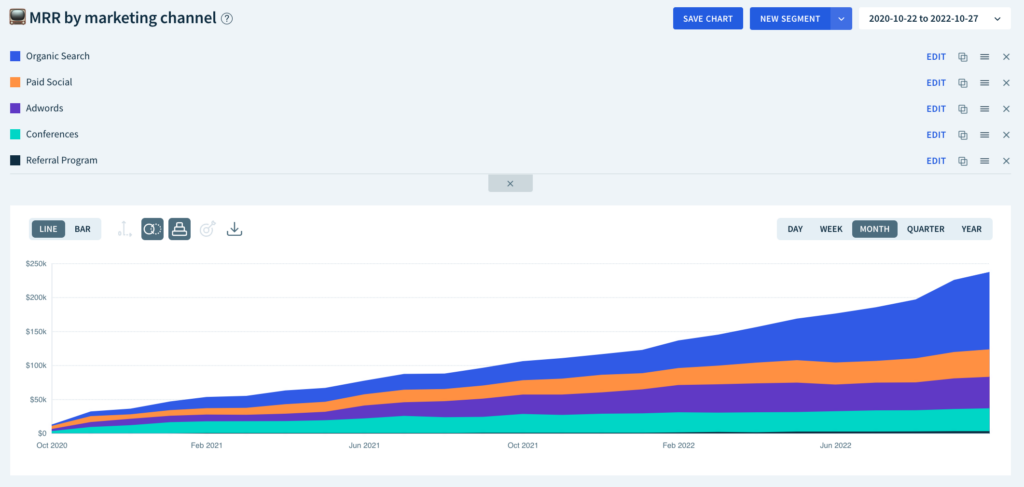
Here is MRR sliced by marketing channel, over the same twelve months as above. This gives insights into where MRR is coming from—enabling you to prioritize high-performing channels.
You can go even further than that.
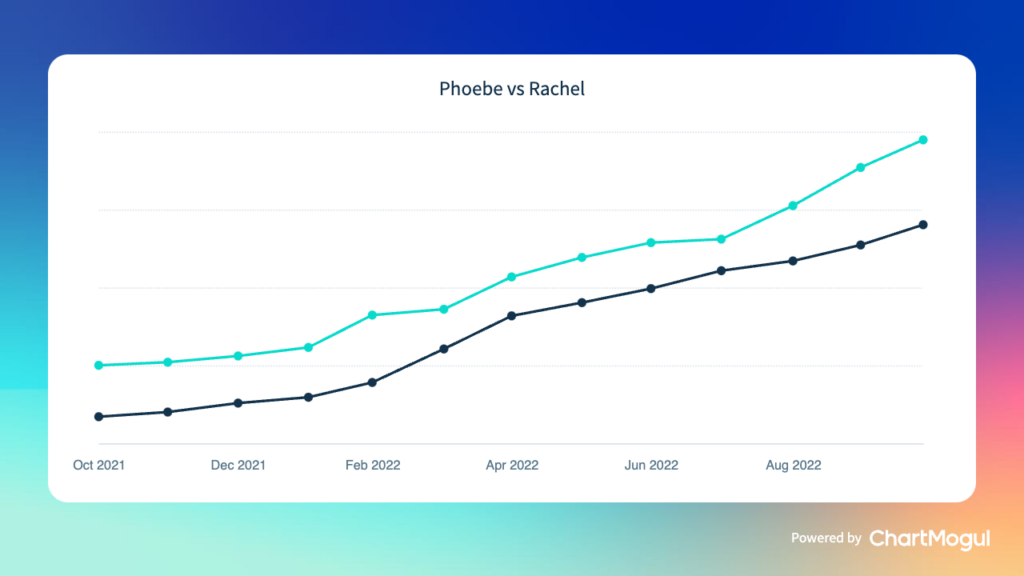
Here is MRR split by two sales representatives, limited to the last year and marked monthly. This would come in handy not only for routine management but also for quarterly performance evaluations.
What are the types of analytics?
Analytics can be ad-hoc sessions or routine deep dives, and different questions get different answers. There are four main types of analytics to consider, that answer four different questions:
- Descriptive analytics: what happened?
- Diagnostic analytics: why did it happen?
- Predictive analytics: what might happen in the future?
- Prescriptive analytics: what are the next steps?
These types of business data analytics help companies maximize the usability of their data to extract deeper insights. How?
A number of ways, really. Let’s take a look at two of them.
Cohort analysis
“Cohort is simply a fancy name for a group.” – David Skok
Cohort analysis is a practice of analyzing data by groups of customers, where all customers in the group share a certain attribute.
For example, in ChartMogul the attribute is the time period when users signed up for the service. In this case, you’d have a September cohort containing customers who signed up that month, an October cohort of new customers, and so on. From there, you can see how various cohorts behave over time.
In this example, you can clearly see that people are dropping off in their third month. In ChartMogul, you can zoom in and see the customer activity that contributed to the calculation. You can question the data further to understand why you’re seeing higher user churn at the three month mark. You can ask questions like:
- Was a new plan introduced that bills every three months?
- Does onboarding need to be improved during those first three months?
- Do we need to check in with customers at the two and a half month mark?

Cohort analysis can be especially helpful for churn analytics—as it reveals when during the customer lifecycle that a customer is most likely to cancel. Customer success teams can use these insights to work proactively to preempt and reduce churn.
To find out more, download our free Ultimate Cohort Analysis Cheat Sheet and check out our comprehensive how-to guide on cohort analysis using ChartMogul.
Segmentation
Segmentation is the practice of slicing your data to distinguish groups based on different attributes.
For example, you can segment your customer data by industry vertical, to see how customer behavior differs based on what kind of business they are. You could also segment your revenue data by region, to identify what areas of the world are most lucrative and hold the most opportunity for your business.
Segmentation is, on the one hand, a very basic concept—and then very complex on the other. That’s because you can do so much with it.
For an example of how dynamic and flexible segmentation can be, check out one of our deep dive refresher course on Segmentation, where we explain all the ways you can slice and dice your data.
Examples of reporting and analytics for each team
Let’s take a look at some examples of reporting vs analytics to consider the role each plays with your teams.
Notice how analytics typically starts where reporting leaves off, and answers who, what, when, where, and why questions.
Marketing metrics: reporting vs analytics
Reporting metrics:
- # of qualified leads
- Customer Acquisition Cost (CAC)
- LTV:CAC
Analytics:
- What’s our MRR broken down by lead source?
- How much of our new business MRR can be attributed to last month’s Adwords campaign?
- Which marketing channels have the lowest ROI?
At ChartMogul we explained how to analyze the effectiveness of marketing channels using churn rate. With marketing channel attribution data flowing into ChartMogul, you can analyse your different marketing channels by critical revenue metrics rather than by just the number of website visitors.
If you’re using revenue tools like ChartMogul to track your new customers, MRR growth, Customer LTV, etc then you absolutely should be sending marketing channel data in so that you can segment these metrics by channel and understand what’s working and what isn’t. – Aaron Beashel, Co-Founder at Simul Docs
Sales metrics: reporting vs analytics
Reporting metrics:
- New business MRR
- ARR
- Conversions (demo>trial>purchase)
- CAC
Analytics:
- Which reps bring on accounts with the highest retention?
- Which verticals constituted our highest sales last month?
- How many free trial customers came on board within one week of the product demo?
Customer success metrics: reporting vs analytics
Reporting metrics:
- Customer retention
- MRR retention
- Expansion MRR (Upsells)
Analytics:
- At what point are subscribers at the highest risk of churn?
- Which team members secure the greatest amount of expansion MRR?
- Is retention above average for any particular verticals, or for customers in particular regions?
Finance metrics: reporting vs analytics
Reporting metrics:
- Net cash flow
- Non-recurring cash flow
- Refunds
Analytics:
- Profitability analysis across any axis within the business: products, services, accounts, payment plans, geographic regions.
- What percentage of revenue comes from recurring vs non-recurring transactions?
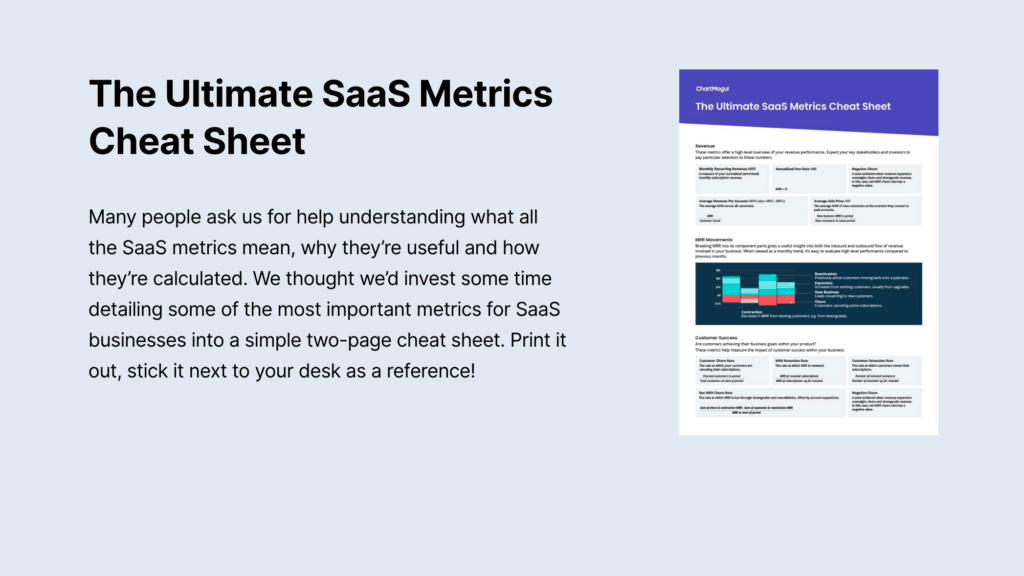
A little rusty? To brush up on some of these SaaS metrics, check out the Ultimate SaaS Metrics Cheat Sheet, which gives you an overview of all of them. We’ve also got our SaaS Benchmark Report—where we’ve analyzed anonymized and aggregated data from ChartMogul to help you find out how your key metrics compare to your peers.
What comes next
Investing the time, tools, and personnel in analytics is only worth it if you, well, do something about it. The real meat of analytics lies in using the findings to inform practical and tactical elements of your business growth. Improving best practices so that metrics improve—this is the value add.
So, what do you do once you’ve analyzed your data?
Quick rundown of a follow-up process:
- Assemble the results of the data analysis as well as likely explanations for those results. For example, this could be to create a saved chart or download your chart to include in your investor report.
- Communicate findings to key players. This can include employees at any level. When it comes to numbers and performance, transparency is the best policy. It fosters understanding of the metrics and of one’s impact, buy-in, and enthusiasm for new goals and tactics, and ultimately the foundation for a data-driven culture.
- Identify goals and the strategies you’ll change or tactics you’ll test.
- Determine a time to check the results. Two weeks? 30 days? Be sure to allow enough time for results to appear. Don’t let the desire to move fast impede your ability to learn from what you’re trying.
- Perform the same analysis to assess whether the changes produced the intended results.
Analysis gives you insights, but it’s up to you to act on those insights. Otherwise, you might as well have left it at reporting your core metrics.
Final thoughts
The bottom line is that both reporting and analytics are necessary, and both are valuable.
But they are not the same thing.
Buzzwords often pick up in the tech world, and all of a sudden everyone is using word ‘X’ to describe thing ‘Y.’ Words shift meaning based on how they’re branded.
That’s what’s at risk with reporting and analytics. Great analytic efforts are misrepresented as reporting, and standard KPI displays are hyped as analytics.
In anything, losing vigilance with language costs us clarity. In business, if we confuse terms like this we don’t clearly see the function we’re actually performing (or paying for). As a result, we might also miss the opportunities the function reveals.
If this seems like a dramatic take on the issue, that’s just because at ChartMogul our whole mission is around helping our customers build a better subscription business.
We provide a reporting and analytics platform, and we want our product to not only inform but also empower our users.
We hope this disambiguation has been helpful in identifying the differences between the two. Please now go forth, seize your data, and engage in both reporting and analytics to strengthen your team and grow your business.
Reporting and analytics: FAQs
What is the best subscription reporting and analytics platform?
The best reporting and analytics platform provides businesses with the tools necessary to investigate data and uncover key insights. It should cover the four types of analytics and offer data anlytics features, as well as a wide variety of integrations for connecting your data across platforms.
There are ample options on offer, but we—of course—back ourselves. ChartMogul’s industry-leading platform provides businesses with key business intelligence insights that enable better decision-making.
Where to start with analytics and reporting?
As a SaaS business, you’re likely already reporting—it’s analytics you need to catch up on.
If you create KPI spreadsheets and report on your core metrics, you’re already reporting. Analytics starts when you begin to dive deeper into the why and so what of your business intelligence.