Before we get started let’s just make clear that no-one is interested in actually hunting any of these wonderful animals ;)
Before reading further I do recommend skimming Christoph’s most recent blog post on the subject.
As people who run subscription businesses we all like making money. But not everyone is on a trajectory to get to $100M in the next few years. However, this doesn’t mean the animals analogy can’t be a useful tool for understanding your business. And perhaps helping you lift your ARR growth angle so it is on a path to reach $100M.
I recently got to thinking about which animals we are hunting at ChartMogul, which led me to try and answer this question using ChartMogul.
To build out these charts in ChartMogul I started by creating 5 segments (1 for each animal). However, to make this work as a chart we’ll need to assign each animal an “ACV range” as it’s unlikely you’re charging your customers exactly, $100, $1,000, $10,000, etc. per year.
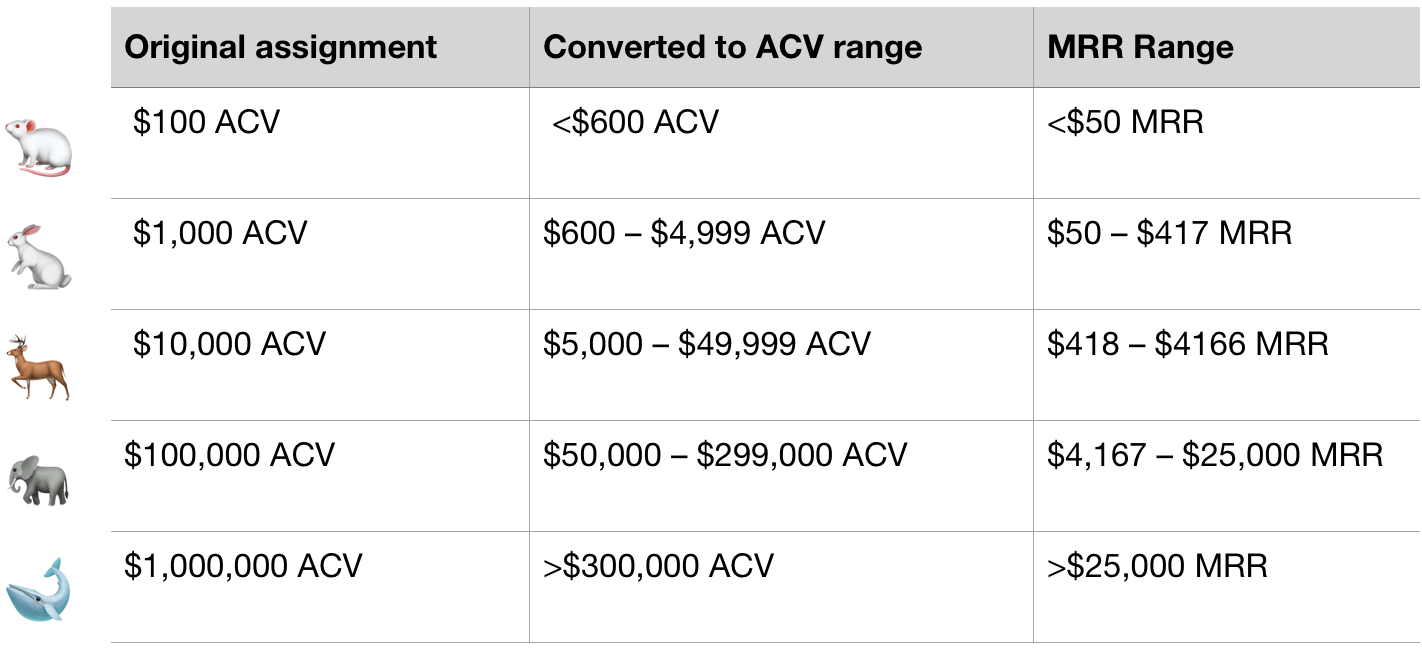
So, I came up with these translations. It’s not an exact science but this gives us a good place to start and you can always tweak it for your business. I made the starting threshold for Whale quite a lot smaller than $1M ACV so more businesses perhaps have a chance to actually win some whales :)
The reason for including the MRR range in the above table is for this next stage. ChartMogul doesn’t have a way to filter by ACV so we convert ACV to MRR by dividing by 12.
Building your animals chart
The next step is to navigate to the ARR chart and click the “New segment” button 4 times. You should now have 5 segments open. Then create the following segment configuration:
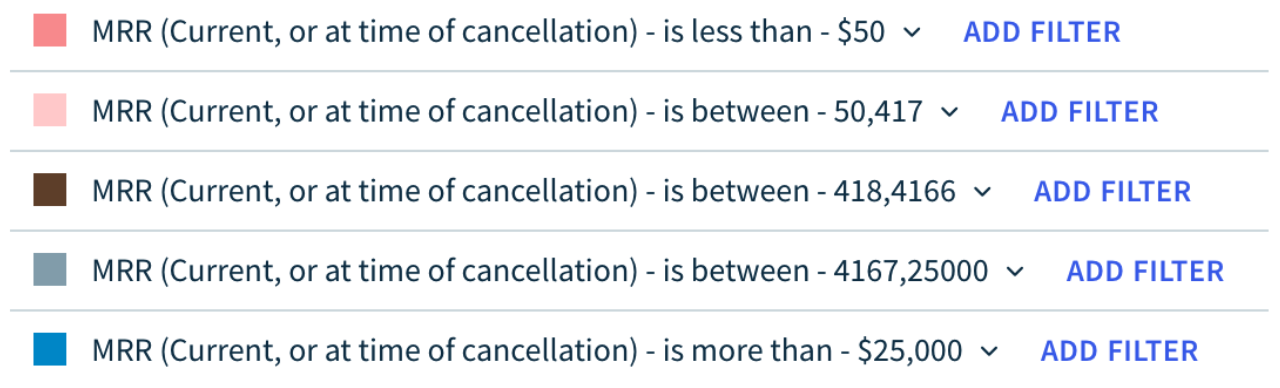
Click this link to auto-create the above so you don’t need to do a lot of clicking. (pro-tip: I got these non-standard colors by editing the URL directly)
Then we save the segments:
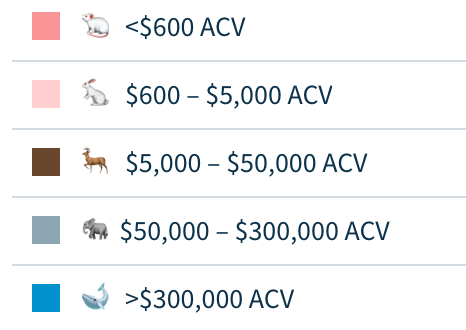
Now you can navigate around the various default charts, ARR, Subscribers, Customer Churn Rate, Net MRR Churn rate and the segments should persist as you navigate.
What we discovered
Below is our ARR chart sliced by animal (sorry I removed the Y-axis labels).
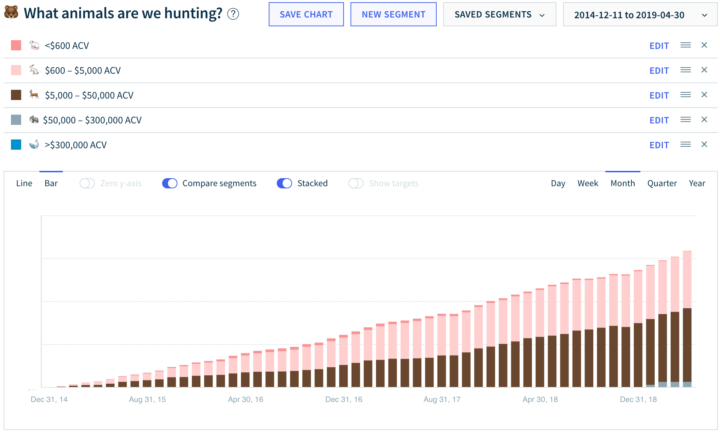
On seeing this chart a few key things became clear to us
- We’re no longer hunting mice, most of these accounts were transitioned onto our Free Launch plan and don’t show up in an ARR report.
- We make the vast majority of our revenues from rabbits and deer, and now have a few elephants too.
- As most growth is coming from deer (and elephants) these are the animals that are probably going to bring us our future growth. But that doesn’t mean we shouldn’t focus on smaller animals. After all, in SaaS, thanks to it’s compounding nature. It’s often just a matter of time before a rabbit becomes a deer ;-)
One more thing
For those signing up for a new free trial of ChartMogul, we’ve gone ahead and pre-loaded this chart into your default set of custom charts. Existing customers will need to build this chart by hand, but we hope the above instructions give you a head start.