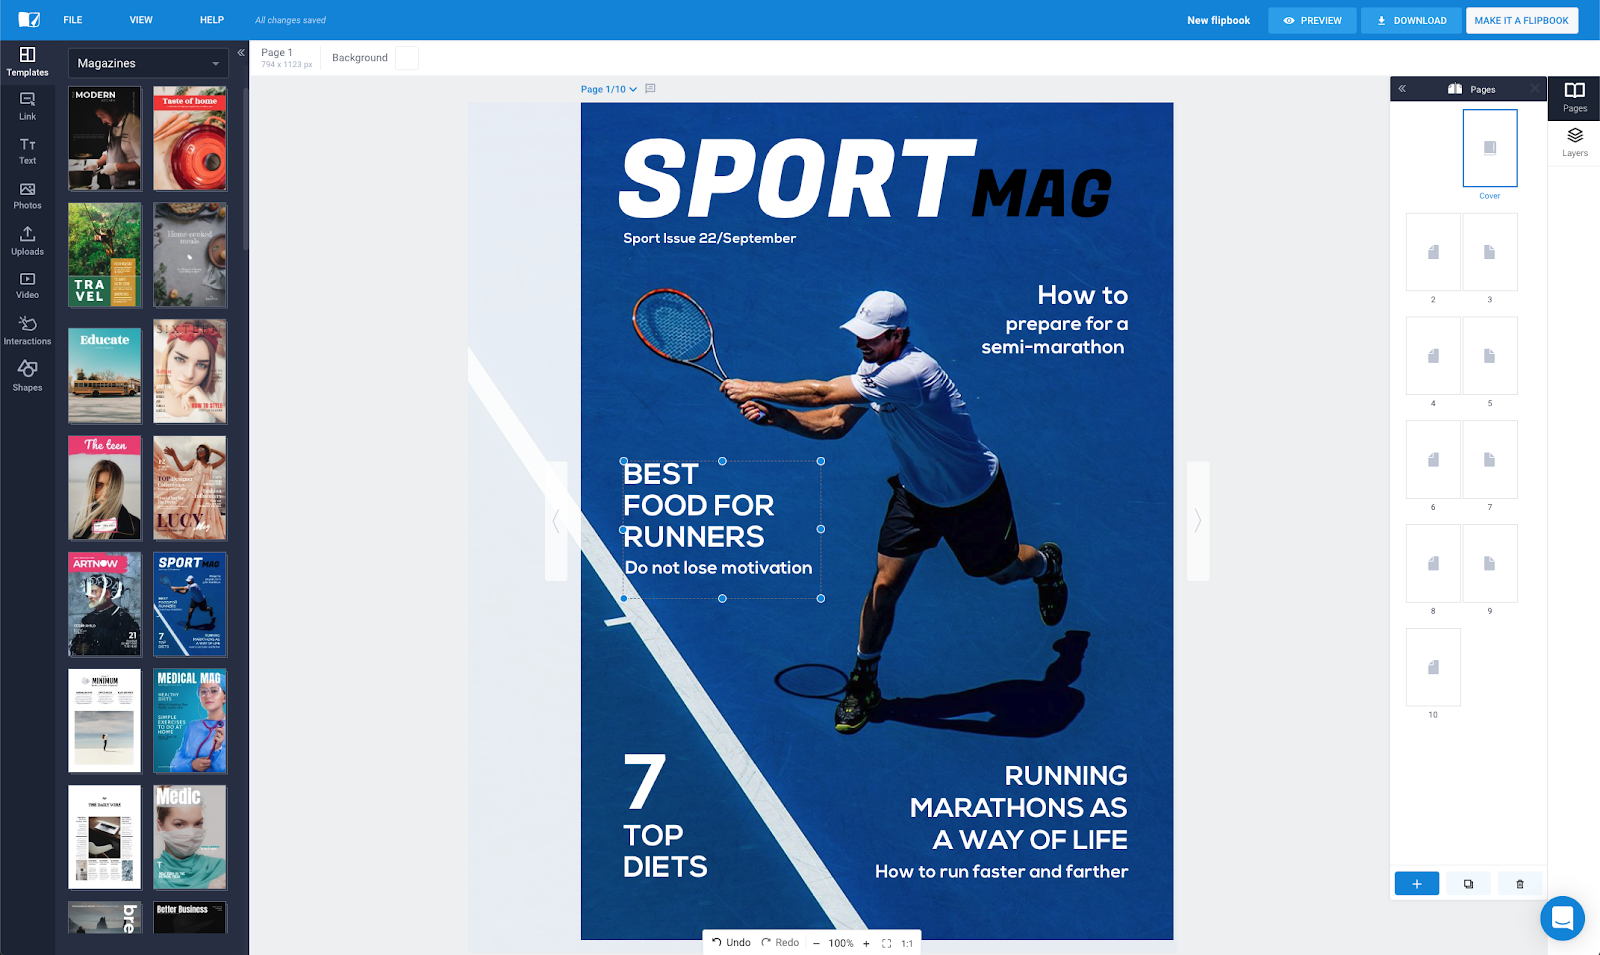
Flipsnack is a professional digital publishing tool that can be used to easily publish captivating online magazines, transforming your PDFs into an online page flip experience.
San Francisco, USA and Oradea, Romania
SaaS
50 employees
Product and marketing use ChartMogul to gather data, run better campaigns, improve the product, and learn faster.
What is Flipsnack?
Flipsnack is an online publishing tool that can be used by anyone to create flip page digital catalogs directly in their browser.
Through interactive publications and rich media experiences, Flipsnack aims to provide a successful publishing platform to help businesses thrive in the digital world.
Anyone can make a flip page catalog by simply uploading a PDF file, or by designing it directly in Flipsnack, using its intuitive drag and drop design tool.
Flipsnack was founded in 2011 in Troy, Michigan and has continually grown. Now, it has about 3 million users from all over the world: the USA, South America, Australia, Europe, and Asia.
Janina Moza, Flipsnack’s Marketing Manager, tells us how she and the rest of the team use ChartMogul to track revenue metrics and understand the impact of marketing and product initiatives.
The Challenge: Tracking key revenue metrics in-house is time-consuming
Before the team started using ChartMogul, they asked their engineers to build a simple tool to allow them to track their key revenue metrics.
The tool they got was really a long list of transactions exported from their billing system. The team had to import this data into a spreadsheet and build custom models on top of it. Only after going through the whole ordeal they could see their MRR, churn, and other metrics.
The whole process was cumbersome and cost the team a lot of time. Janina estimates that it was taking at least 1 day/month for up to 3 people.
The team initially thought that building the required tool internally would allow them to save time and money. However, they quickly realized that using a tool built by domain experts is actually much cheaper down the line.
Whether you elect to build internally or hire a dedicated person who feels comfortable working with raw data and building models with it, you’re going to tie in resources that come out of your company’s bottom line. It would also mean these people are not working on another customer-facing project that hurts your ability to outstrip your competitors.
The Solution: Switching the bicycle for a Ferrari
Janina quickly realized that it’s not just her team’s work hours that were on the line. The growth of Flipsnack was put on a card too.
They needed a faster way to collect data and insight into the progress of their company in order to be able to move quickly and launch new marketing and product initiatives.
Going from our custom reports to ChartMogul is like switching a bicycle for a Ferrari. They are hard to compare — it’s not like one is bad and the other is good. But if you need to get somewhere fast, you’d always choose the Ferrari. For us, that’s ChartMogul.
Flipsnack started using ChartMogul in early 2017. Like many other customers, the team started researching all available revenue analytics solutions. They quickly realized that ChartMogul is not just the best, but the only one that can provide a solution for their needs.
We had a unique problem that no other tool could solve. Our parent company had multiple revenue streams generated by other projects. The problem was that because all the income went into the same account, with other analytics providers we couldn’t separate the income that was generated by Flipsnack from the other revenue streams.
ChartMogul allows the team to create groups for the various pricing plans. Janina calls this “a major advantage” — all users that have access to the Flipsnack account in ChartMogul can use the saved groups and they can also be applied on the dashboard level and to all reports within the platform.
Another challenge only ChartMogul could deal with was adding multiple billing providers. Flipsnack uses Stripe and Braintree to bill their customers. Using ChartMogul was the only option that would allow them to integrate data from both.
Importing data from Stripe was straightforward. Braintree required some custom work, but the customer success team stepped and quickly helped Janina and her team get their data in.
The support team was very helpful, and very friendly as well. You have a really nice customer care team who actually cares!
Running experiments quickly and with confidence
As Flipsnack’s Marketing Manager, Janina owns growth. To keep it on a positive trajectory, she needs a quick way to run and analyze experiments.
Janina gave us 2 examples of such experiments and how ChartMogul helped her team make smarter business decisions:
We had experimented with prices for one of our pricing plans called Starter. We had sold it for both $144 and $168 in the past. So this year when we were planning to make some changes in our pricing, we spent a lot of time analyzing data in ChartMogul and comparing the performance of the various pricing plans we had over the years.
The team noticed that the customer churn rate was lower for customers who bought the more expensive version of the Starter plan, so ChartMogul helped them make a smart business decision about pricing.
In the other experiment, Janina used ChartMogul to test the features offered by premium plans.
Many users come to Flipsnack to design brochures, catalogs or magazines and to download them as PDFs. The PDF download was a premium option, available with a subscription. We suspected this was one of the reasons why we had such a high churn rate for monthly subscriptions: those who needed the one-time download were buying a subscription for one month only and then quickly canceled.
So Janina and the team ran an experiment where they made it possible for everyone to get a copy of the design as a web PDF. This resulted in fewer monthly subscriptions bought, as soon as the free web PDF went live. The churn rate for the monthly subscriptions also went down.
Examining the results of this experiment has been a breeze with ChartMogul. With literally a few clicks, I had all the answers I needed to verify the hypothesis. Since then, we went back to charging for the PDF download feature but we’re still committed to continue testing and find a way to make it work for everyone.
The examples Janina shared with us, show how ChartMogul can be used in any department in the organization — from the CEO and CFO office to marketing and product teams looking to analyze the impact of individual initiatives:
Keeping track of how product updates and pricing updates have a direct impact on MRR and churn rates is a vital part of a product manager’s job and it’s super important for me too. I cannot imagine how it would be to go back to the time when we didn’t have ChartMogul.
The Result: Move quicker, learn quicker, grow quicker
Janina measures the value of ChartMogul in the time it saves the Flipsnack tool. And it saves a LOT of time in her words.
With the resources we have, there are always so many things we can work on. So, it’s always about making a decision on how we spend our time. That’s why time is our most precious commodity.
ChartMogul also helps to align the whole team around their goals. Flipsnack uses the OKR system for goal-setting and performance measurement. The KPIs they look to improve are tied to metrics that they track in ChartMogul, so it’s always easy to know how much progress they’re making.
Understanding the impact of marketing campaigns and product changes
Flipsnack’s marketing and product teams also use ChartMogul to quickly understand the effects of their efforts.
As our tool is constantly evolving, updates can often have an impact on sales. ChartMogul makes it very easy for us to visualize and assess that impact.
Janina also uses subscription analytics with data from other marketing tools (Google Analytics, etc.) to tie specific marketing campaigns to effects on the bottom line and understand their long-term effects.
For me, as a marketer, it’s important to know more than just the number of transactions or the total revenue generated by a promotional discount campaign. With ChartMogul I can look deeper. I can track the LTV and churn rate evolution for discounted orders over a longer period of time and that helps me make decisions regarding future campaigns.
She admits it would be extremely time-consuming to do this with their in-house tool as it would require generating new data, importing it into a spreadsheet, and adjusting all the formulas and models they’re using.
Flipsnack is in the process of hiring their first data analyst and Janina is positive ChartMogul would give her a chance to hit the ground running.
Final words: Deeper knowledge leads to faster growth
The whole team has been hard at work improving the product and reaching new customers — and the results are showing it.
Flipsnack doubled revenue in 2018 and almost doubled it again in 2019.
Using ChartMogul to quickly analyze subscription data is what allowed them to identify and focus on the opportunities with the highest potential to move the needle.