
You know that marketing initiatives drive revenue, but can you prove it?
If you can’t, you’re not alone. While more than 70% of businesses can demonstrate how marketing increases engagement and leads, only 57% can demonstrate how it increases sales.
This is especially problematic given the expectation of today’s senior leaders. Research from the CMO Council found that revenue growth was the top deliverable for CMOs in 2017. 70% of CMOs state that senior company leaders expect marketing teams to show their impact on overall revenue.
The CMO Council also found that a record number of CMOs lost their jobs in 2016. Why? Because of an inability to show business impact.
The bottom line: marketing teams who struggle to show the impacts of their campaigns and initiatives on overall revenue are in a precarious position.
Closed-loop marketing offers a solution.
With closed-loop marketing enabled by modern technology, marketing teams can attribute campaigns directly to sales. This closes the gap between marketing and sales team initiatives, allows for reporting sales figures instead of just leads generated, and enables campaign optimization by highlighting what’s generating revenue and what’s not.
At Ruler Analytics, we use our own platform and several third-party integrations—Pipedrive, ClearBit, Zapier, ChartMogul, and Stripe—to engage in closed-loop marketing. This allows us to track leads across the customer lifecycle and identify the amount of revenue each marketing-acquired lead generates over time.
If you’re struggling to show how marketing initiatives lead to increased revenue for your company, you can replicate our process to start delivering reports that highlight the value of marketing—securing both your job and your department budget in the future.
What Is Closed-Loop Marketing?
“The only way to guarantee a closed loop with accurate information is to let technology capture the information for you automatically.”
Closed-loop marketing is the process of connecting sales conversions back to the marketing campaigns that generated the original leads. In doing so, the marketing team can determine which specific campaigns, channels, and keywords are the most—and least—effective in driving revenue.
But since most businesses have separate marketing and sales teams, it can be difficult to pinpoint which marketing campaigns led to which leads, and which of those leads went on to make a purchase.
In the past, this connection was often made by having sales reps ask customers where they learned about the company, or in the case of online conversions, including a “How did you hear about us” question on forms:
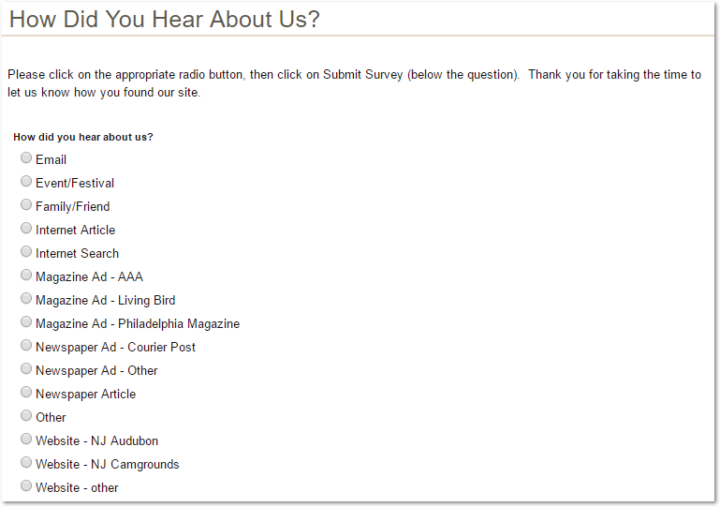
Unfortunately, both of these approaches are prone to human error.
Sales representatives could forget to ask, or forget to feed the answer back to marketing teams.
And while asking on a form guarantees an answer gets sent back to the marketing team, it doesn’t guarantee that the answer is correct. Some customers may not remember how they learned of your company, or they may just make a random selection to expedite the process.
The only way to guarantee a closed loop with accurate information is to let technology capture the information for you automatically.
The exact source is captured and fed through a variety of systems, tracking leads from their initial engagement through the first—and any subsequent—sales, and providing detailed reports on campaign performance and revenue generation.
Our Closed-Loop Marketing System
By using Ruler Analytics and several third-party integrations, we’re able to track and report on revenue driven by marketing campaigns across a variety of channels.
Here’s the process we follow.
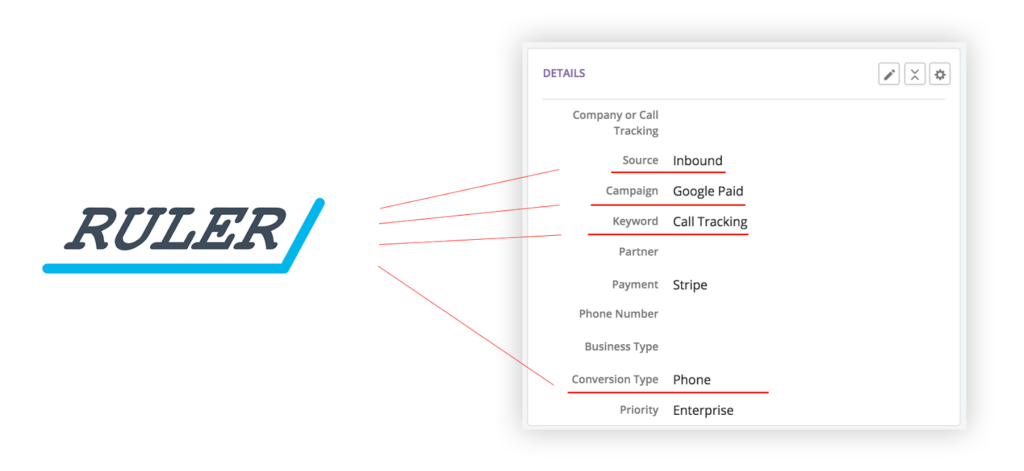
1. Leads submitted by either form or phone call are captured in Ruler Analytics. Ruler Analytics captures each lead’s contact information and their visitor-level marketing attribution data—including the source campaign, channel, first click, last click, and/or organic keyword used—using UTM parameters and Gclid tags.
2. The lead information is then sent from Zapier into Pipedrive CRM for the sales team to process. Each deal has the marketing information passed along with it, combining sales and marketing systems, and creating better alignment amongst teams.
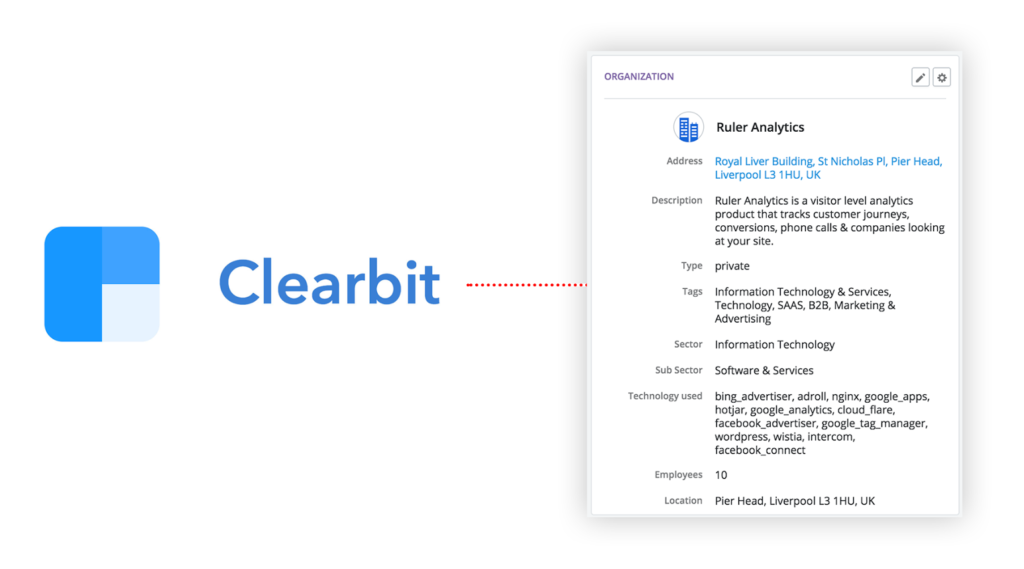
3. Once the deal is in the CRM, we can significantly expand information about the lead using ClearBit’s Enrichment API. ClearBit gives us detailed information about the company where the lead works, including sector, location, revenue, and employee count.
4. When a lead converts, a Zapier integration sends the contact information—including all of the initial marketing and company data—to either a database or Google Sheet. This data syncs with ChartMogul periodically throughout the day.
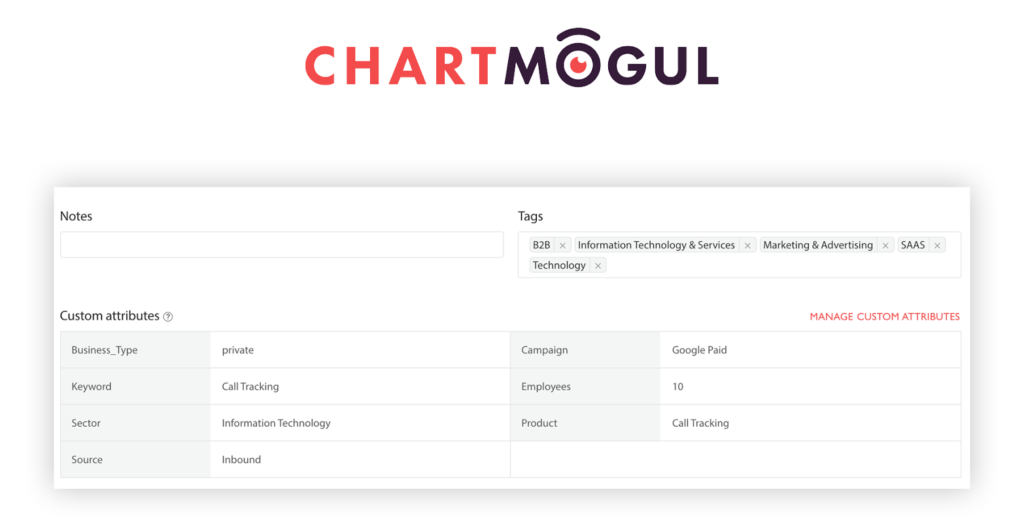
5. In ChartMogul, we’ve set up custom attributes to capture the marketing and enriched company data. This allows us to manipulate data to create custom reports with the platform’s filters and data visualizations.
6. ChartMogul also connects directly with our payment processor, Stripe. Because of this, every month the revenue we are generating from each customer gets attributed back to all of the data we have, allowing us to track and report on any subsequent sales.
![]()
Note: We use the full process for enterprise customers only. For small and medium enterprises (SMEs), we use a self-serve model. Revenue data is still captured in the self-serve model, but SME leads do not go through the CRM system.
While it takes time to set up and integrate each of these systems, the end result provides tremendous value and a variety of benefits.
The Benefits of Closed-Loop Reporting with ChartMogul
“…when we started making more use of Custom Attributes, it transformed from an operational tool to something that sits above our sales and marketing, impacting our business right up to the director level.”
Once the data is in ChartMogul, we use a ton of saved filters to get insight into the performance of different aspects of the business.
First and foremost, we’ve been able to transform our marketing from a cost-centre to a revenue generating machine.
What does this mean?
With marketing attribution, most people report on the success of their marketing based on leads and conversions. This is good, but leads and conversions don’t always prove that marketing campaigns are impacting the bottom line.
Now, we’re able to see exactly which campaigns, channels and keywords turn into revenue.
By default, ChartMogul allows us to filter on the following customer values:
- Country
- City
- Lead Creation Date
- Free Trial Date
Using these values, we built a brilliant operational dashboard that sped up our reporting and gave us a lot more clout when meeting with our board and investors. When you’re meeting with leaders, it’s important to make sure you’re speaking the language they want to hear.
As impressive as your traffic or conversions might be (or even worse, social media metrics), people at that level only care about bottom-line growth.
There’s no other platform available that has come close to ChartMogul in allowing us to achieve this. Out of the box, it’s an amazing product. But when we started making more use of Custom Attributes, it transformed from an operational tool to something that sits above our sales and marketing, impacting our business right up to the director level.
With Custom Attributes, we can extend the reporting to include the following values:
- Business Sector
- Product/Feature Used
- Marketing Source
- Marketing Campaign
- Marketing Keyword
- Salesperson
- Number of Employees
This has opened up a new world of opportunity for us, and has made ChartMogul one of the most used tools by our sales, marketing, and operations teams.
Some examples of how we use it:
We measure the average lifetime value of our different sectors and business types
In fact, this insight has been one of the biggest drivers of growth over the last few months. Using ChartMogul, we were able to identify that a niche of one of our major sectors had a ALTV of 1.4x over any other.
The niche was also a good fit for our experience, so instead of focussing our sales and marketing teams on an entire market, we shifted our focus down to where we know people get a lot of value from us. As a result, our MRR has grown 2.5 times quicker in the last two months than the two previous to it. When you consider compounding, this is a huge result.
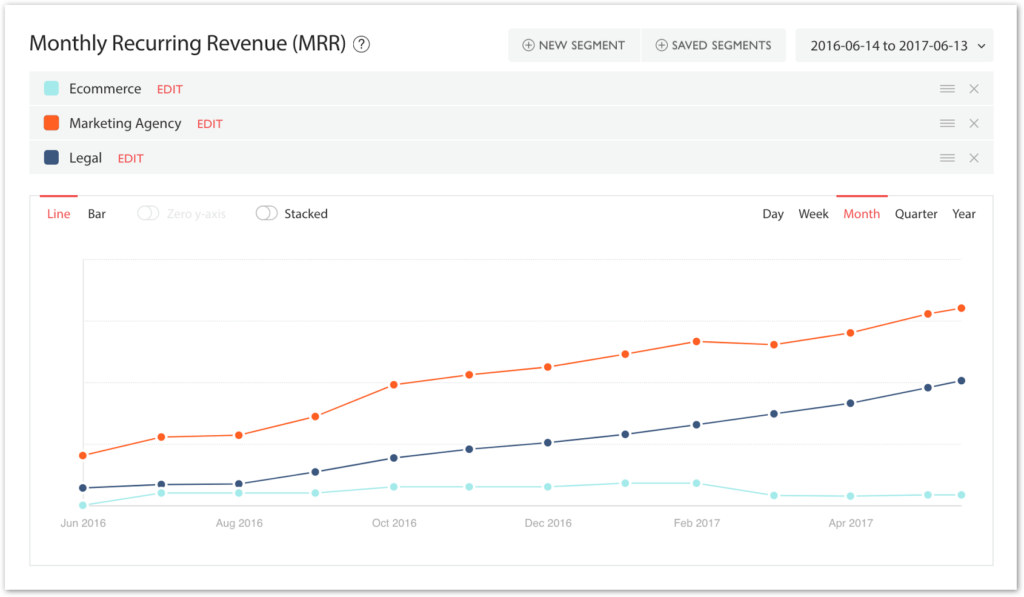
In the example above, you can see two sectors we’re strong in (agencies & legal), vs one we’re traditionally not strong in (ecommerce).
If in the future we decided that the ecommerce sector was going to become a target market for us, we could use this data to monitor trends and measure how successful our efforts had been. For now, it allows us to build more successful sales strategies because we have a quantified understanding of who the most valuable sectors are.
We can calculate which salespeople are bringing in the most lifetime revenue, and monitor to see if our sales incentives are impacting our numbers
Our sales bonuses are calculated off of a percentage of the revenue our customers have generated each month. Monthly revenue data—segmented by customer—is provided by ChartMogul, making it easy for us to adjust the bonus with every expansion, contraction, addition, and churn.
Our sales bonuses also vary from time to time in order to incentivise our reps to help us hit certain goals. For example: if we want to grow our users in a certain sector, we’d increase sales incentives for that sector and monitor ChartMogul to see if this was reflected in the trend.
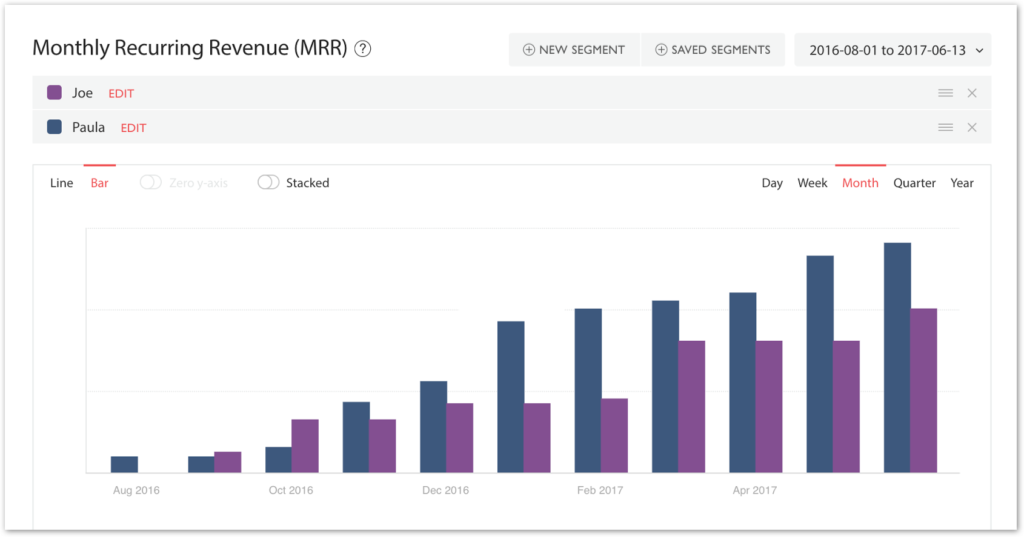
In this graph we can see the total amount of monthly recurring revenue generated by two sales individuals over time. This data is used to calculate bonuses. Note: this data has been altered to maintain privacy.
We use the data to measure how we’re growing geographically
Although we’re a digital product that can hypothetically be used by anyone with access to a computing device and the internet, because we work with call service providers there’s an element of localisation to our business.
At the turn of the year, we began working with a call service provider that covers mainland Europe. Because we tag the locations of the businesses we work with in ChartMogul, we’re able to segment our data and measure the impact that particular deal, and our marketing activity in that area, have impacted the business on the metrics that matter.
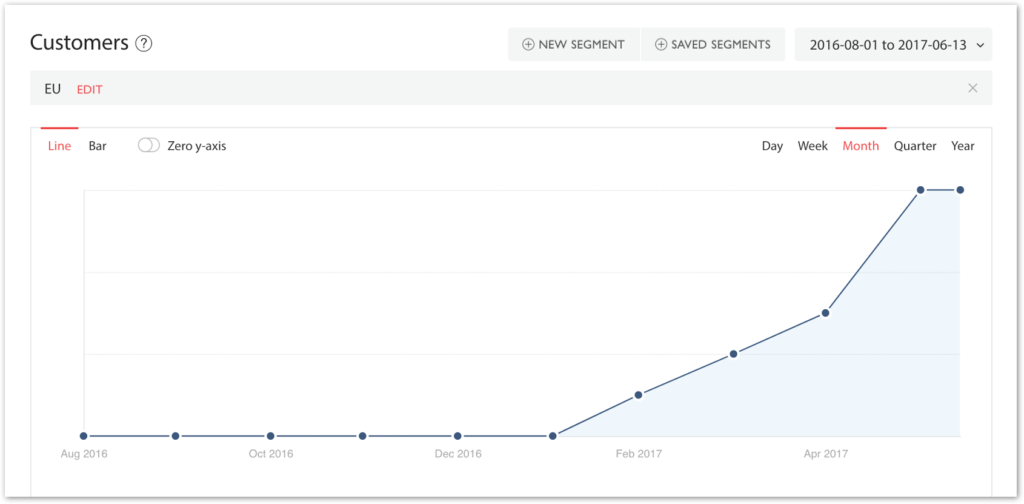
Although we’re still in the infancy of our penetration of the mainland EU market – it’s clear to see that there’s a growing number of customers. A positive start that we can continue to build on – a validation we wouldn’t have achieved without geographically segmented customer and revenue figures.
We can measure the impact of our marketing based on all of ChartMogul’s revenue metrics: MRR, CLTV, Average Sale Price, Churn Rate… everything!
This was huge for us. In our eyes, this is the natural evolution of marketing analytics. Pre-internet, marketers relied on estimated eyeball and readership figures. With the internet came impression and click tracking, then Google Analytics popularised the concept of conversions.
At each stage we’ve gotten closer and closer to real business impact, but with ChartMogul, we’re there! We can now measure the exact impact our marketing has had on our bottom line.
Because all of our marketing data is passed into ChartMogul, we can see so much more than just which campaigns bring us leads. Previously, we would’ve judged our ROI based on the average lifetime value of our customers, but now we can see the exact amount of revenue that each campaign has brought us.
Using Closed-Loop Analytics to Prove Marketing ROI
In our modern, data-driven world, marketing teams can no longer rely on reporting traffic increases, leads generated, and increased engagement to prove their worth to organizations. Instead, they must show the specific ROI of their initiatives and campaigns to secure jobs and budgets for the future.
With modern technology, you can track this information automatically, and produce detailed reports that highlight the value of marketing in a way that’s impossible to question.
But proving ROI is just one of the benefits of closed-loop marketing. It is also an extremely valuable approach for marketers in their daily jobs because it highlights what’s working, what’s not, what could be improved, and what’s wasting your budget.
Closed-loop marketing is a win-win-win approach. Marketers win because they can prove their value and uncover which efforts produce the best results. Sales reps win because they can earn commissions and bonuses across the entire customer lifecycle. And company leaders win because they can see the direct outcome of their investment in marketing.