
This guest post was written by Caya Jose, CEO of Slidebean — A SaaS presentation tool allowing anyone to create professional-looking slide decks in minutes. Caya uses ChartMogul to track the company’s metrics and exports them to a slide deck used for investor updates. Here, Caya shares his best practices for what to include (and why).
If you haven’t figured it out by now, Investor Updates are a key part of your job as a CEO. Keeping your current investors updated will let them have a better understanding of your month over month performance and will avoid bad surprises if suddenly things go south. Many of your investors will also jump in to help or advice you if they have any experience in your roadblock.
As for potential investors, sending a monthly or bi-monthly blurb about your progress will also keep your name and company on their top of mind. We actually raised a third of our latest financing round thanks to our monthly investor updates.
Now for SaaS products, the metrics investors will want to look at are a bit specific. Showing that you have a clear grasp of your SaaS metrics is key. It’s not only about understanding what each metric means, but having an educated understanding of the variables affecting and the impact your action plan is having on this performance.
We have been using ChartMogul to track and export these numbers to our pitch deck template for a while. We have two versions of the slides, what we call an ‘intro deck’ that includes just the surface information, and a ‘full (confidential) deck’, that makes a deep dive into analytics and includes notes with our conclusions about the performance.
Here’s the set of SaaS metrics your investor will want to look at:
Basic – Month-over-Month growth
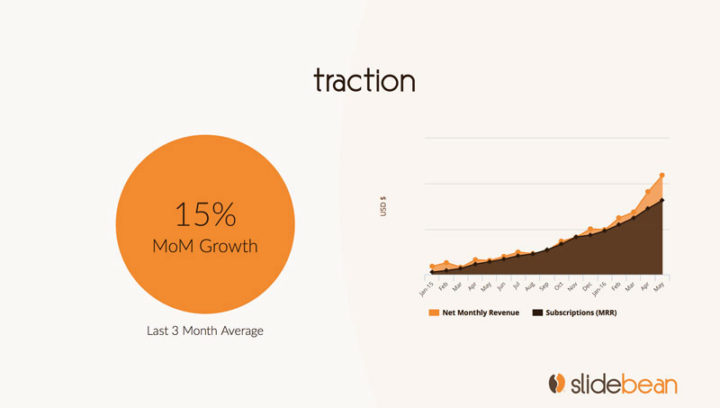
Probably the most common slide you’ll find in a SaaS deck, your latest (or 3-month latest) MoM growth, and a line chart reflecting this over time.
For most industries, investors will want to see double-digit percentage growth during the first stages, in many cases ranging between 15-25%. Showing both the chart and the number also confirms whether this growth has been constant, or if it’s speeding up or slowing down.
Basic – Churn Rate
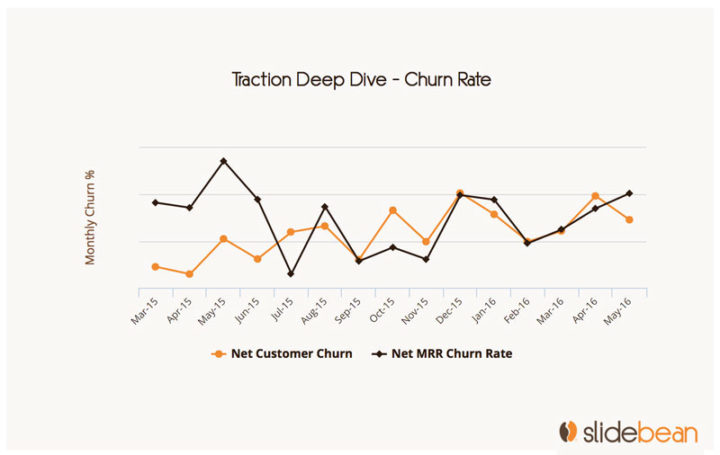
As important and fundamental as % of MRR growth month-over-month, churn talks about your ability to target the right customers and retain them long enough to make a significant profit over what you paid to acquire them.
Low churn and/or churn trending down is a reflection of a team understanding their users and their business (let’s call this product-market fit), and taking the appropriate actions to increase the LTV of their customers.
Deep Dive – CAC vs LTV
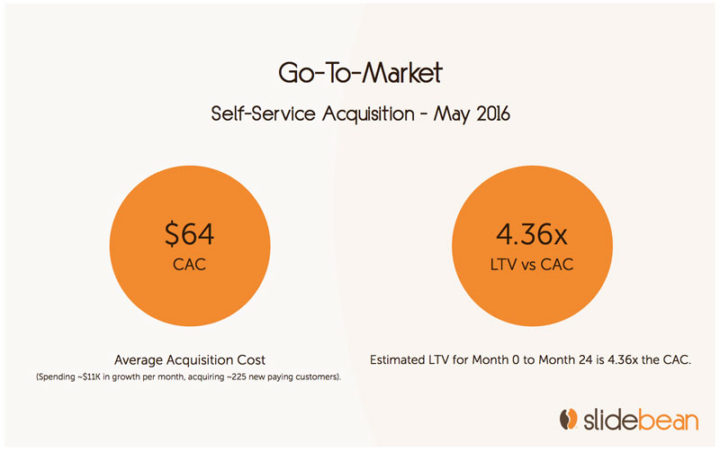
Cost of Acquisition vs Lifetime Value is one of the backbone SaaS metrics. Tracking this one will require you to build a separate system to keep track of your CAC, which may range from a spreadsheet to a more advanced channel like Kissmetrics.
Also, there are some variables you can choose to account for or ignore in your CPA.
Possible CPA measures;
- Direct cost of ads.
- Direct cost of content promotion or any other.
- Cost of retargeting ads.
- Cost of the marketing team and the sales team (if any).
- Cost of the onboarding/customer success team (if they affect conversions).
In our case, we have a ‘standard’ CPA which covers elements 1 through 3, and a ‘full’ CPA which includes all of the above.
It is quite standard to aim for LTV > 3x CAC (your lifetime value should be 3 times your acquisition cost, at least), and you should be able to recover the CAC within the first 12 months.
Deep Dive – CAC vs growth spend over time
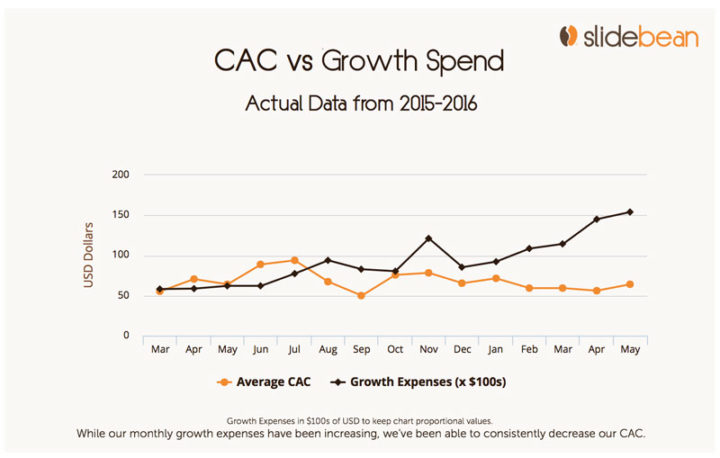
Proving that you are able to increase your customer acquisition budget, while maintaining or lowering your CAC is a scalability test for your product.
Cost of acquisition is bound to increase as you start targeting broader audiences and that is understandable, however, a month over month increase in CAC should be accompanied by an increase in LTV, always being careful about not breaking that 3x ratio.
Deep Dive – MRR Distribution by plan
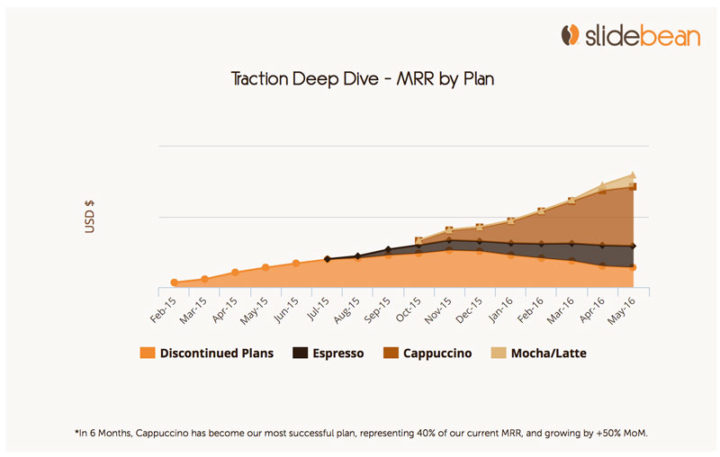
While a monthly or quarterly pie chart can show your revenue distribution at a given moment, visualizing this on an area chart lets you see the evolution of your MRR distribution over time.
In our case, it reflects the focus we’ve made on implementing new plans every few months and whether we can successfully scale them to keep growing.
Deep Dive – Revenue vs CAC by Cohort
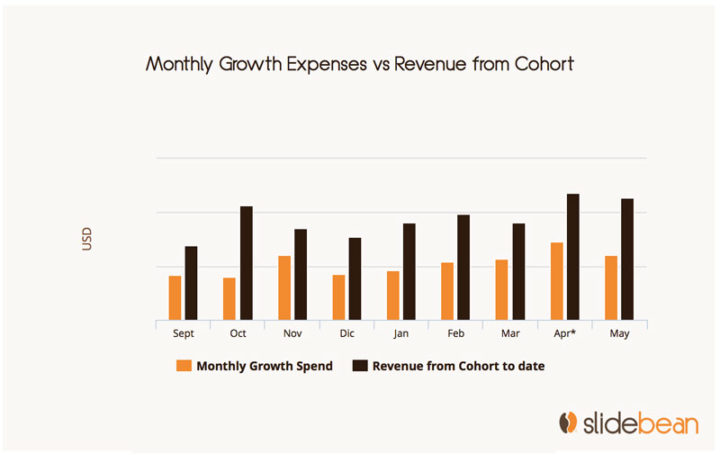
Last but not least, one of my favorite visualizations of SaaS metrics is this Growth Expenses vs Revenue from Cohort report. It reflects how much cash was spent in a given month to acquire customers, and how much revenue have those users generated to date.
As I mentioned above, the revenue from a cohort should exceed that month’s spend in no more than 12 months. In the case of Slidebean, we’ve been able to expedite this by encouraging users to subscribe to yearly plans instead of monthly. A little bit about that here.
If you want to brush up on the SaaS metrics mentioned here, for inclusion in your own investor updates or simply to understand your business, check out the ChartMogul collection of free cheat sheets and resources.