Forecasting sales. This has been a challenge for companies since…well, since we started selling things.
This was a challenge even when we companies operated with a traditional sales-led approach — when we had salespeople interacting with every customer and able to provide input on a forecast.
But then came the product-led growth model which has proven that your business can grow while having little, if any, traditional sales interaction with the majority of our prospective customers. And this model has taken the forecasting challenge to a whole other place.
But what if you are operating with both models? What if you are a modern SaaS business with both a product-led motion as well as a traditional sales-led approach AT THE SAME TIME?!?! Meaning, you have customers self-serving their way to conversion (and expansion) AND you have a sales team that is selling into higher-value accounts in a high-touch way?
How can you possibly forecast sales with this type of hybrid approach?
Well…you need to design a hybrid forecasting model. And that is what we will explore in this post.
Let’s start with a look at the different methodologies:
- Sales-led forecasting
- Product-led forecasting
The sales forecasting formula
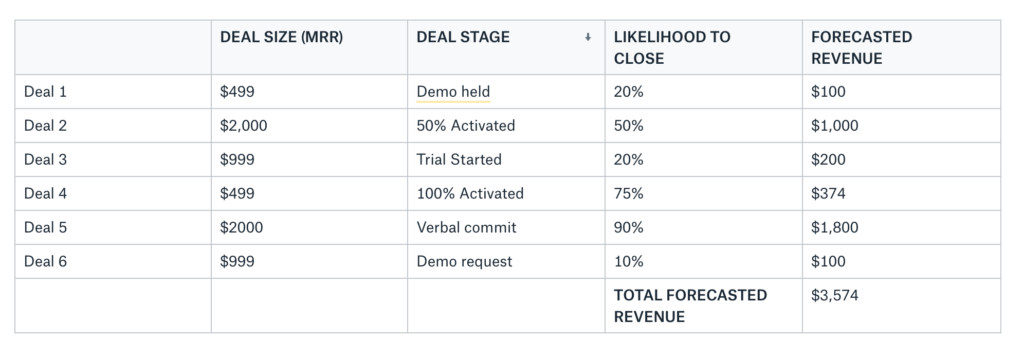
Before we get into the specifics of the different methodologies, it’s important to look at the calculation that underpins any sales forecasting practice (often called a weighted pipeline). It’s pretty basic (and I’m sure if you are reading this, you have used this calculation before). To forecast sales of any new deal, you use the formula:
Amount of deal x Likelihood to close = Forecasted revenue
For example, if you have a potential $10,000 deal that is 50% likely to close, that would contribute $5,000 to your forecast. When you do that across all the deals in your pipeline, it would look like this:
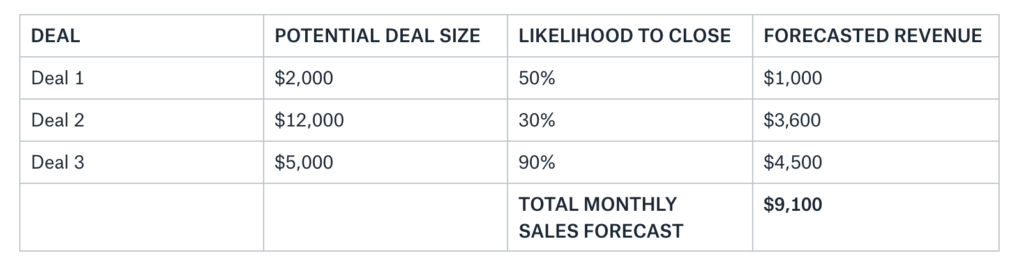
Pretty simple, right?
Well…as the math goes, yes, very simple. The challenge is actually plugging in accurate and unbiased values in the calculation.
Potential deal size
For sales-led forecasting, potential deal sizes are typically generated by the salesperson working the deal. This information is usually derived from sales conversations:
- How many users will you need?
- How much data will you be tracking?
- Are there freemium features that are interesting to you?
From these answers, a salesperson is tasked with estimating the deal value. If you have relatively standard pricing structures, estimating potential deal size can be done fairly accurately. For traditional enterprise deals, the potential deal size is really what a salesperson thinks he/she can charge.
With product-led forecasting, this becomes easier (in most cases). Product-led businesses typically have fairly standard pricing tiers, especially for the initial conversion. This means that potential deal sizes for new conversions can be easily plugged-in.
With that said, in the general forecasting model, the potential deal size is NOT the most challenging piece. The more challenging piece for any forecast model is calculating the LIKELIHOOD TO CLOSE.
Amount of deal X Likelihood to close = Forecasted revenue
And this is where we will focus most of our time in this discussion.
LIKELIHOOD TO CLOSE represents the most significant difference between the two forecasting methodologies.
- In a sales-led forecasting model, LIKELIHOOD TO CLOSE is based on sales stage
- In a product-led forecasting model, LIKELIHOOD TO CLOSE is based on product engagement
Let’s dig in.
Sales-led forecasting methodology
If you have ever done forecasting in a sales-led environment, this process is going to look very familiar.
In a traditional sales-led approach, deals are managed in a CRM and salespeople are charged with updating the all-important DEAL STAGE field.
This single field represents, perhaps, the most important field in your CRM set-up. It is this field that is used to determine the LIKELIHOOD TO CLOSE for each and every deal. It looked a little something like this:
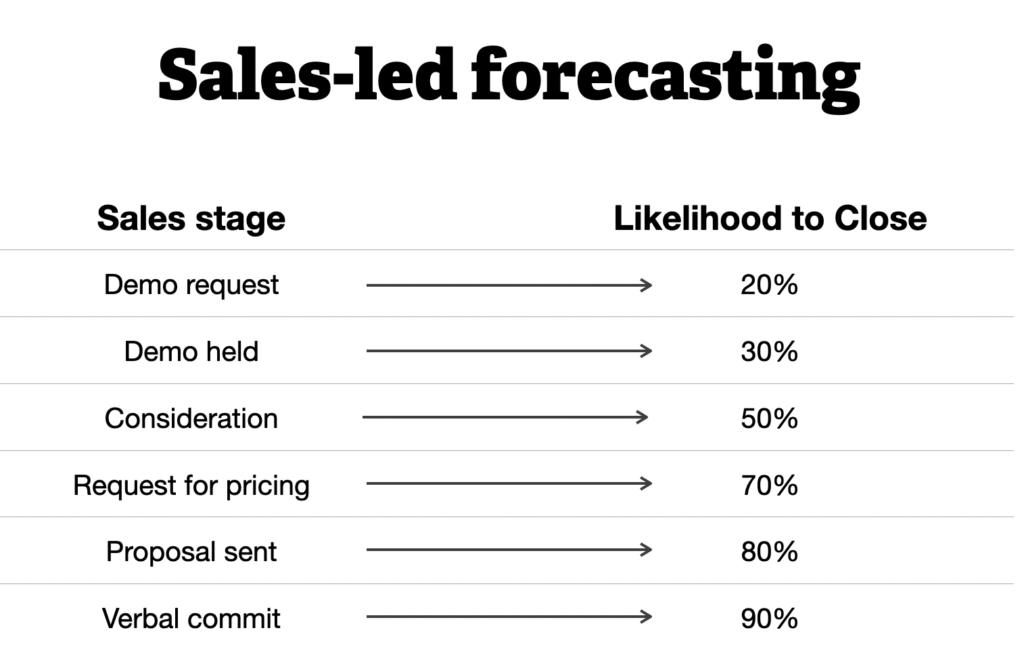
Translating deal stages into Likelihood percentages is the basis for a sales-led forecasting model.
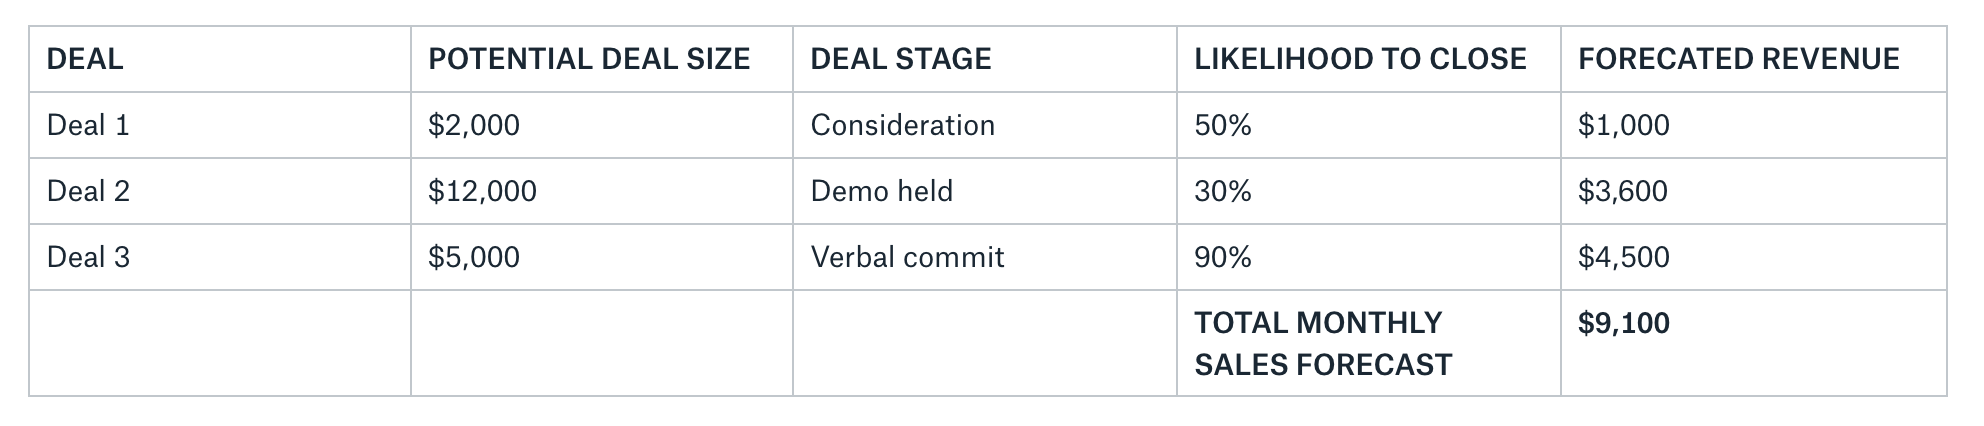
Voila…your forward-looking forecast! This methodology should be no surprise to anyone who has done any forecasting in the past. It’s fairly standard. Not great, but standard.
Product-led forecasting methodology
The emergence of the self-serve, product-led model has turned much of the traditional software operation on its head — and it’s completely upended revenue forecasting. As shown above, traditional forecasting models are dependent on a salesperson’s interaction with a prospect. But a pure-play product-led model is designed to eliminate the sales interaction. SO….
How do you build a forecasting model based on sales stages when…there are no sales stages?
Tweet this quote
In short, you don’t. You build a different model.
Two approaches to forecasting revenue in a product-led model
There are really two approaches forecasting in this new world. The first is a TOP-DOWN approach and the second is a more detailed, BOTTOM-UP approach.
APPROACH 1: TOP-DOWN APPROACH (not recommended)
If you’re like most SaaS businesses that have been around for a while, you probably have some historical data that tells you on average how many of your trial leads convert to paid every month. With a TOP-DOWN approach, you simply take this average conversion rate and apply it going forward.
For example, let’s say your monthly conversions for the past few months have looked like this:
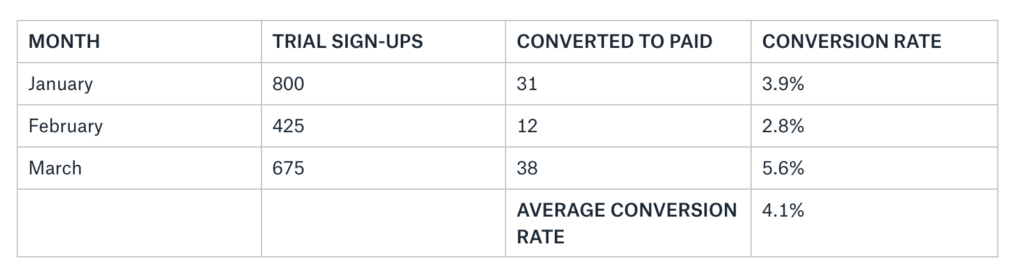
On average, you have a 4.1% conversion rate.
If you take that average and do a little math magic, it’s easy to get a rough estimate of net new MRR in future months. Watch:
Conversion rate x Number of trials x Average revenue per customer = Net New MRR
It’s certainly simple and manageable. But it’s not ideal. Just look at the variation in conversion rate over the past few months in this example. This is very common. Lazily applying the average conversion rate across the number of trials is missing a big factor — the quality of those trials. And their LIKELIHOOD TO CONVERT.
Lucky for you, there’s a way to modify this equation so it takes into account both the volume and quality of your trial signups.
APPROACH 2: BOTTOM-UP APPROACH
This method of sales forecasting is more in line with the sales-led forecasting outlined earlier. This method evaluates each individual trial and predicts its Likelihood to Convert.
But how do you determine this Likelihood to Convert?
It’s all about product engagement.
In a true product-led motion, how a trial account is engaged with the product during a trial is the biggest determinant of their Likelihood to Convert. If they see value with your product, the more likely they are to pay for it.
But how do you measure that? It’s all about product engagement. More specifically, we recommend using a simple metric — Activation Rate.
What is the Activation rate?
Every new trial account must do several things before they can see value with a product. And these “things” are unique to every product. These are a product’s “Activation steps”. For example, the Activation steps for a SaaS company with a GSuite plugin for email collaboration might look like this:
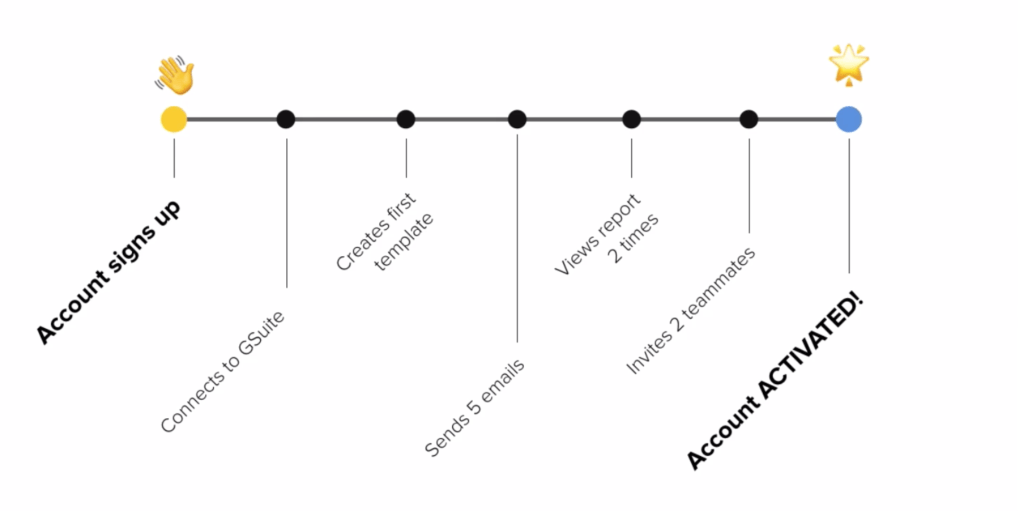
Activation Rate is simply the percentage of steps completed. If an account or user has done 2 out of the 5 steps above, it is 20% Activated. 20% of the way to hitting first value with the product. If it completes 4 out of 5 steps — it has an Activation Rate of 80%. Pretty simple.
While the Activation steps are going to be different for every product, the Activation Rate will always measure how likely an account is to convert. It makes sense, right? The more value someone has gotten from your product during their trial period, the more likely they are to pay for the product after the trial is over.
Activation as a proxy for the likelihood that they’ll convert
Just like with sales stages in the sales-led forecasting model, translating Activation Rate into Likelihood to Convert represents the basis of a product-led revenue forecasting model.
To translate Likelihood to Convert from Activation Rate, have a look at some of your historical data. Identify a relationship between the two. For example, in our business, we know when a trial account gets to about 50% activation or above, they convert to paid 70% to 80% of the time. Similarly, we know that, if someone gets to an Activation rate of 25% to 50%, they will close about 20% of the time. Anyone less than that is not going to close. (Even our most optimistic salesperson agrees with that statement!)
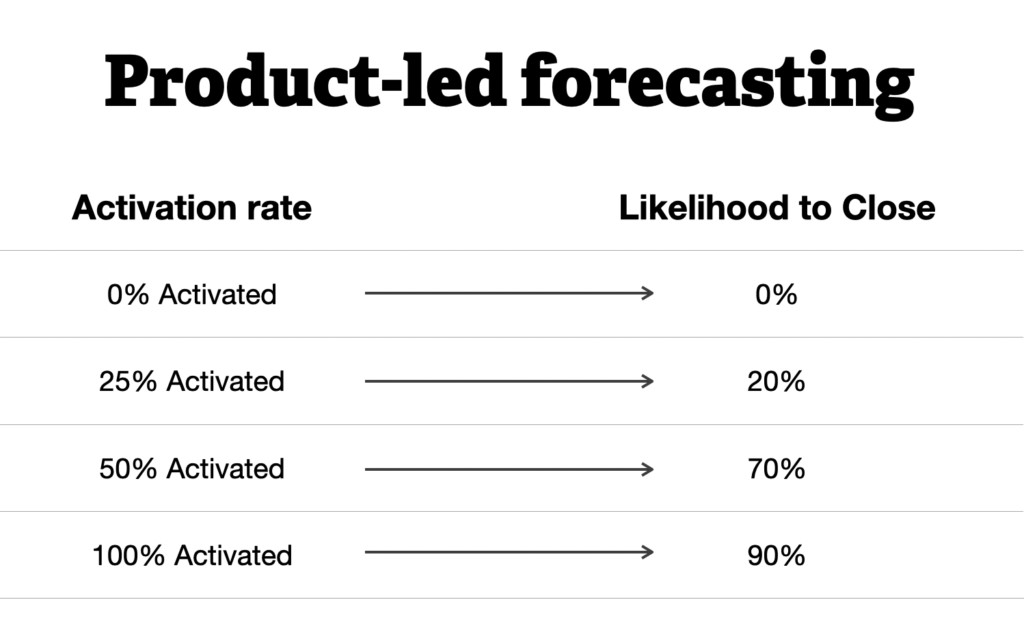
Here’s what a product-led growth revenue forecast for our business might look like when taking into account Activation rate.
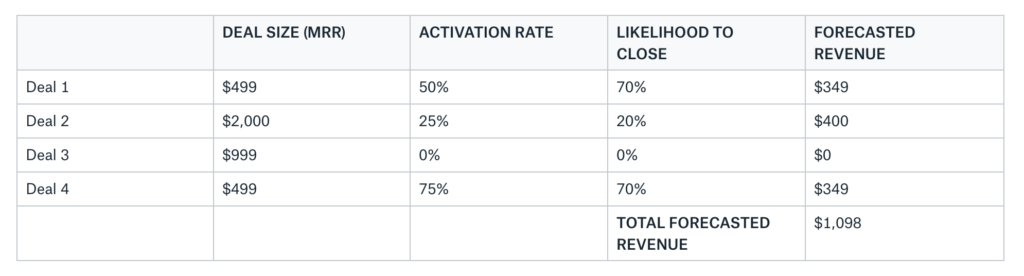
And the best part — we’ve found Activation works even better than the guesstimates of an overzealous (or under…zealous?) salesperson. That’s because it’s based on an objective measurement of how much value users are getting from the product, not a person’s estimation of how much they can make an account believe in a future promise of value.
Ok, great. But, again, what if you are product-led AND have a sales team?
And this brings us back to our original question.
How do you create a revenue forecasting model for a SaaS business with both a product-led AND a sales-led motion???
Tweet this quote
Very few SaaS businesses operate on a purely product-led model. The vast majority product-led companies also employee a sales-led motion – whether that is against the entire prospect base, or focused on the (potentially) higher-dollar deals. Either way, this hybrid structure calls for a hybrid forecasting model.
Does this mean we have to completely segment our customer base into “those who talk to sales” and “those who don’t”? That seems like a complete PITA…
This is one way to approach the problem, but yes…it is a PITA. And a lot of work. And, in many cases, it won’t work because these are some muddy waters. As anyone that manages a sales team in a product-led business can tell you — it’s impossible to keep salespeople from contacting as many potential customers as possible. Which means, it’s near impossible to have these segments completely separate.
Instead of using two completely different forecasting models, we recommend combining them into a single “series of stages” (ok, ok….it’s a funnel) that can account for both motions at the same time.
What would that look like? Something like this:
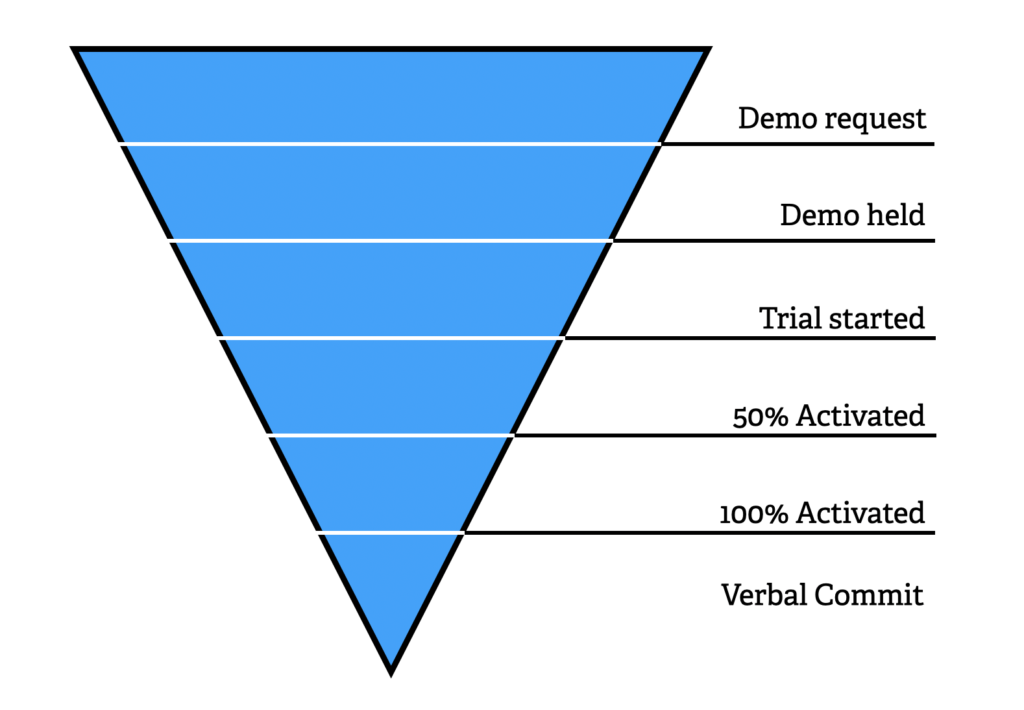
As you can see, this funnel combines “stages” from both the traditional sales-led motion (Demo request, Demo held, Verbal Commit) as well as product-led motion (Trial started, 50% Activated, 100% Activated). This new funnel (these new “stages”) can then be translated into LIKELIHOOD TO CONVERT percentages. Like this:
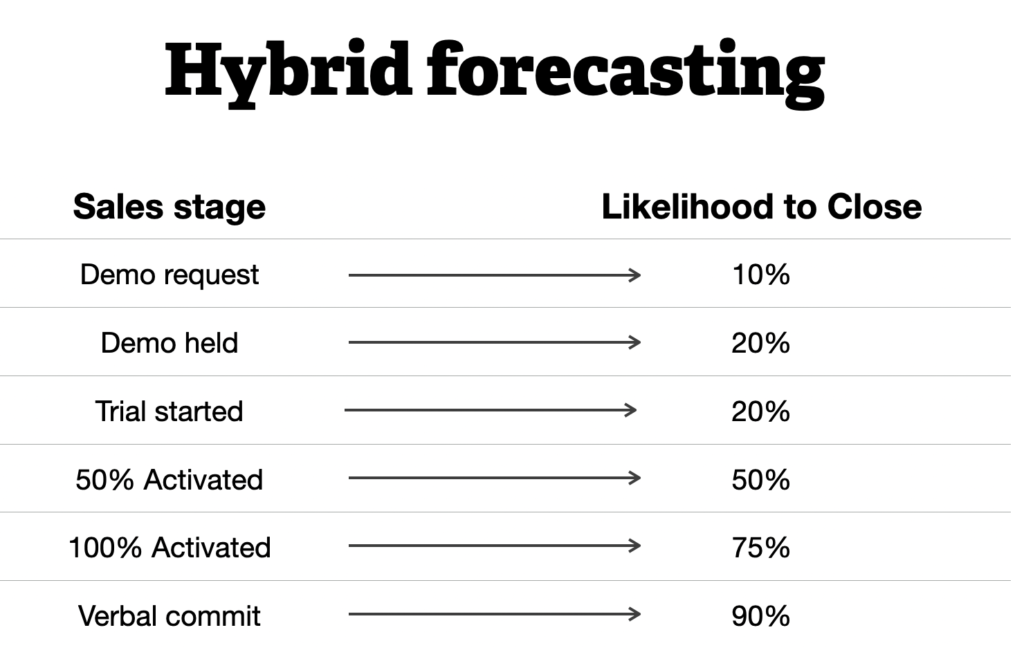
Viola! A new forecasting model that accounts for product engagement AND sales interaction at the same time.
Your new, hybrid forecasting model would look something like this:
With this model, it doesn’t matter if a prospective account talks to a salesperson before starting a trial or not. Either way, its “stage” can be captured.
One assumption this model (safely) makes is that every account will go through some form of trial before deciding to convert. Even those accounts that come in through a sales process aren’t going to buy the product without trying it first. This is just the way of the world as it stands. This means all additional stages from a traditional sales-led model are unnecessary — until you get to a verbal commit.
The demo “bumper”
I know what you’re thinking now:
This all makes sense, but it doesn’t always represent our customers’ journey. Many times — maybe in most cases — our team talks to an account AFTER they sign-up for a trial.
And many times, you will see higher conversion rates on accounts that get an assist from your team (as Tom Tunguz from Redpoint Ventures found in his 2019 SaaS survey). So…how do you capture this scenario in your hybrid forecasting model? How do you account for:
Trial sign-up → Demo held
OR
Trial sign-up → 50% Activated → Demo held
Or maybe even
Trial sign-up → 100% Activated → Demo held
In these cases, you may want to apply what we’ll call a “demo booster”. This is simply a way to “boost” the likelihood percentage of any deal that has received a demo (regardless of when). This means that “Demo request” or “Demo held” will not exist as their own sales stage. You would use the product-led stages mentioned earlier and simply boost any likelihood forecast by 10%. It would look like this:
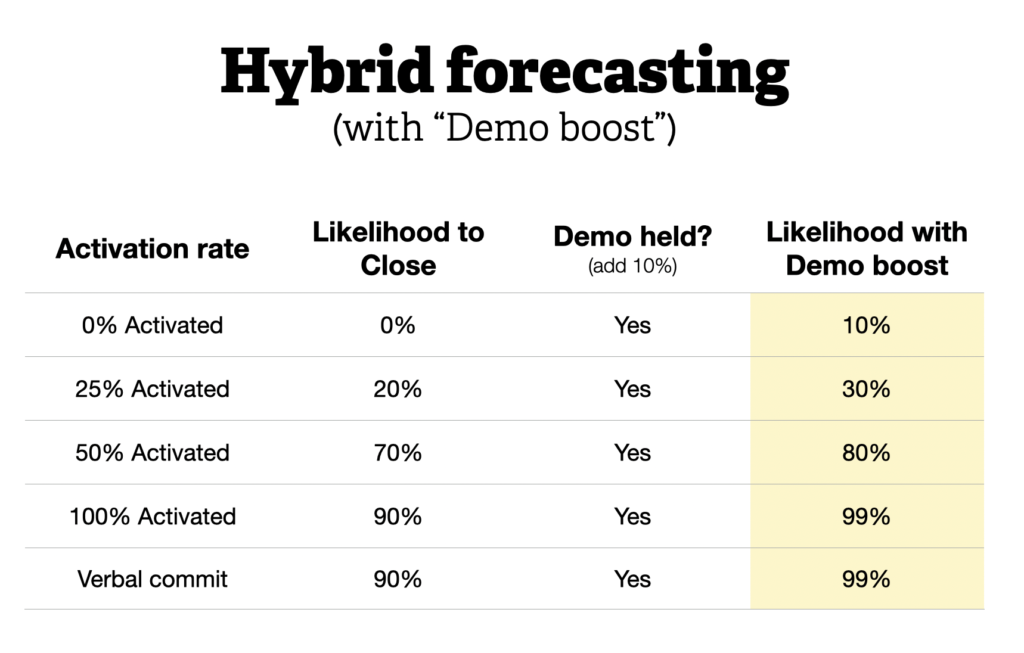
This “demo boost” model is probably more in-line with how the process works for many of today’s product-led businesses. It’s a little more work to execute (mostly because it adds an extra step to an existing process), but it’s really not hard. And more accurate.
It’s worth a little extra work to have a forecasting model that is more in-line with your customers’ actual journey.
Not an exact science — but incredibly accurate
Sales forecasting is not an exact science. It never has been and it never will be. But that doesn’t mean you shouldn’t put more rigor into it to create a model that is in line with your go-to-market motion.
The models presented here are designed to do just that. The goal is to encourage you to think about how to infuse product engagement data into your sales forecasting models. The specifics of how you do it aren’t as important as the process here. Give it a shot. I promise you won’t be disappointed. In fact, you’ll wonder why you didn’t do it a long time ago.
About the author
Derek Skaletsky is a SaaS entrepreneur and founder of Sherlock — the leading product-engagement scoring platform helping companies drive their product-led operations.