
Segmentation in ChartMogul is completely flexible, allowing you to get the view of your data you want to see. One key application of this is discovering how product usage impacts metrics such as Customer Retention Rate, Trial-to-paid conversion rate and Customer Lifetime Value (LTV).
Segmenting your metrics by product usage enables you to measure the correlation between user actions in your product (e.g. feature usage, login frequency, etc) and subscription metrics such as MRR. This also lets you compare how certain features or actions impact your conversion and retention rates.
This article shows you how to achieve this, and is split into two parts:
Tracking product usage
Note: Unless you’re already tracking product usage on your website, you may need a developer to help you set this up.
How to capture product usage data
You can track product usage with a number of analytics tools such as Kissmetrics, Intercom, Mixpanel (and many more).
By adding product usage attributes to customers in ChartMogul, you can see the impact of product usage and features on metrics such as MRR, LTV, Customer Churn rate, and Net Cash Flow.
You may already be tracking customer product usage in other software such as Segment or Intercom. In which case, you could use Zapier to send product events directly to ChartMogul as customer attributes.
Tip: Learn how to add attributes to your customers in the ChartMogul Help Center.
If you’re not already collecting customer-level product usage, you’ll need some help from a developer to start tracking customer attributes. You can track product usage using Ahoy.js, Purser.js, or with a custom script. You can add attributes to customers using the ChartMogul Enrichment API. You might find it useful to refer to the following article: Tracking marketing attributes with Purser JS.
Pushing the data to ChartMogul
Switching to hypothetical mode, lets say you run a subscription video on-demand (VOD) platform like Netflix and you wanted to answer the following question:
Who is more likely to churn: Customers who watch House of Cards, or customers who watch Daredevil?
To do this, you could track whether customers had watched either of the shows and push add an attribute into ChartMogul to represent that. For example, if a customer watched House of Cards, you could add the attribute ‘watched house of cards = true’ to the customer in ChartMogul.
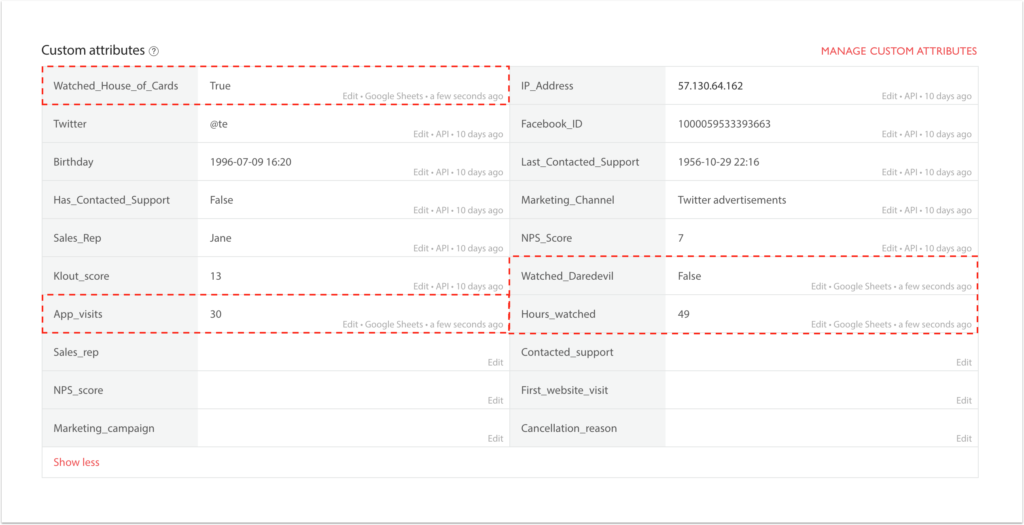
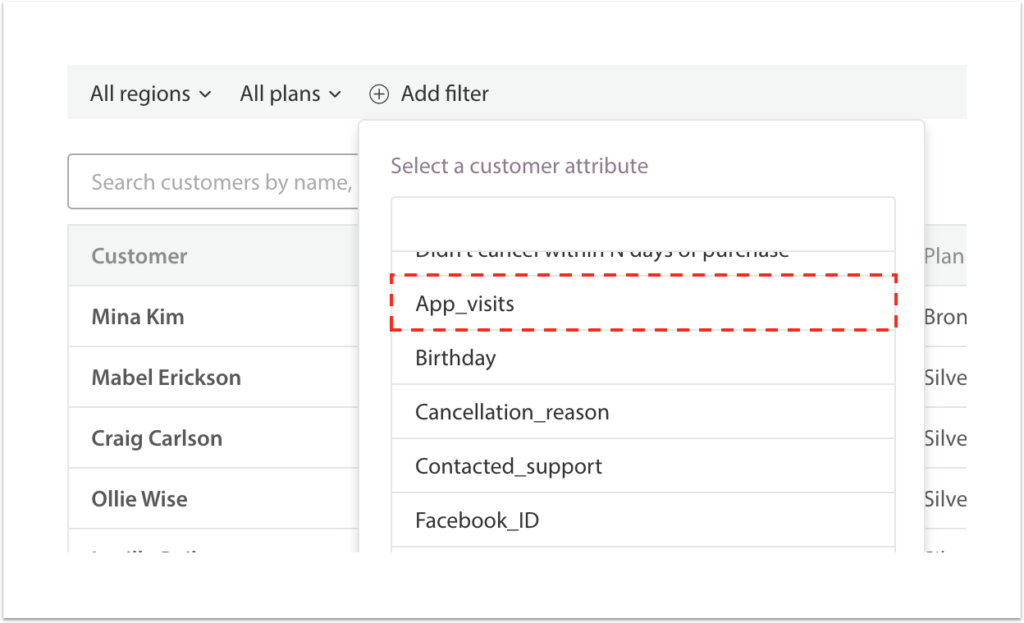
Once you’ve added an attribute to a customer in ChartMogul, it will appear on their customer profile, and in the ‘All Filters’ drop-down menu:
Segmenting metrics by product usage
Once you have added product usage attributes to your customers, it’s time to filter and segment your metrics in ChartMogul and get a view of your customers that’s specific to in-product actions.
Viewing trial-to-paid conversion rate by product action
You can analyze and improve your Trial-to-paid conversion rate by finding common in-app actions usually taken by leads who converted to paid. These actions are effectively conversion indicators you can use to optimize aspects of your product, like the onboarding experience.
Using the method described above, add onboarding-related boolean attributes to your leads and customers, such as ‘created_account’, ‘invited_team_mates’, ‘imported_data’. These will be specific to your product. For example, Twitter might add the attributes ‘sent_first_tweet’ and ‘followed_5_people’ to their users.
To see if a product action leads to a higher trial-to-paid conversion rate, follow these steps:
- In ChartMogul go to your Trial-to-paid conversion rate chart
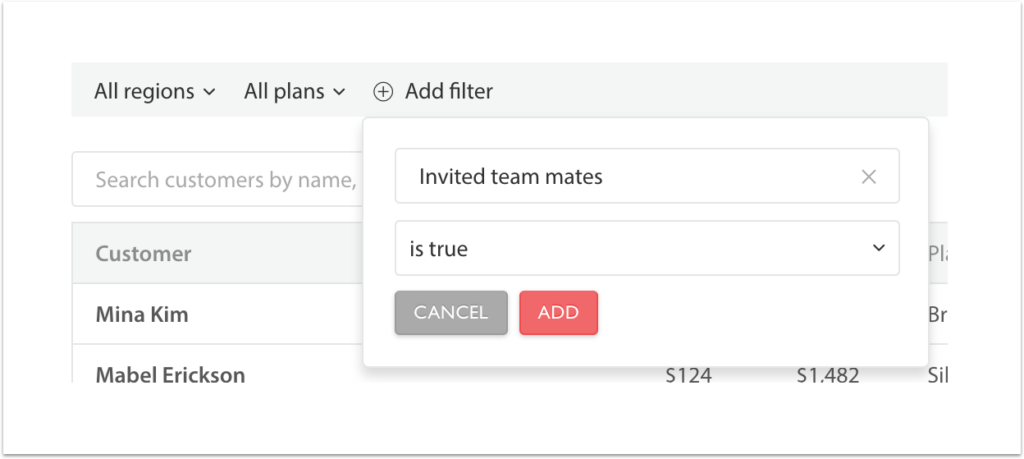
- Click Add filter and select Invited team mates > is > true
- Click New segment and then click Add filter and select Invited team mates > is > false
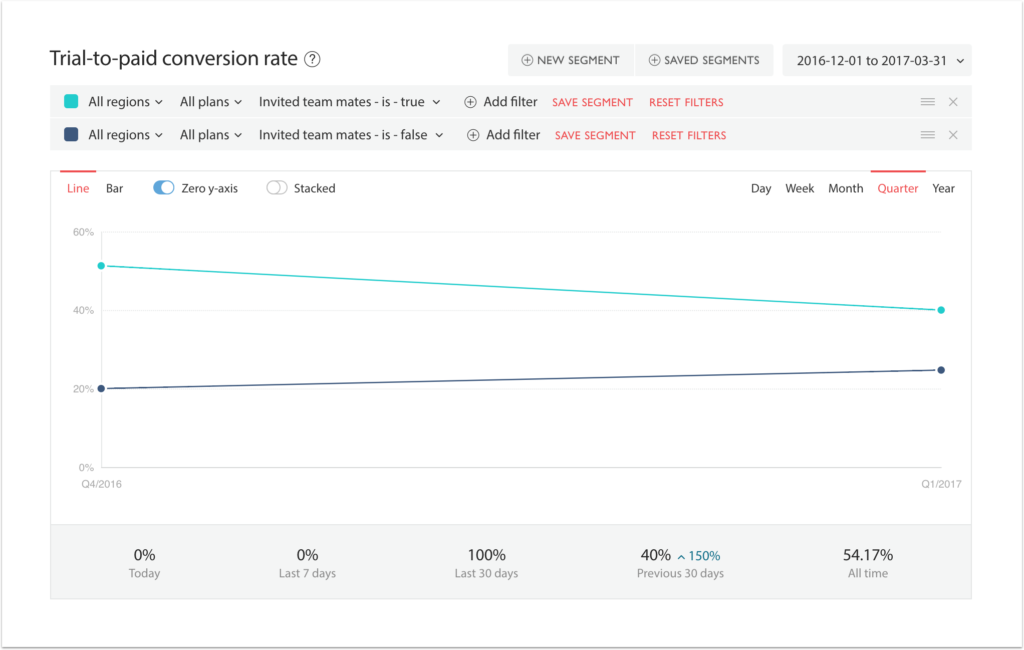
In the example below we can see that leads that invited team members were almost twice as likely to convert to paid. By adding onboarding attributes specific to your product, you can learn which actions are most frequently associated with leads that convert into paying customers.
Viewing Customer Lifetime Value (LTV) by feature usage
You can see which features are associated with a higher LTV to drive future product development. If customers that use a particular feature set have a much higher LTV, this might indicate that expanding on the feature would increase revenue. Alternatively, driving wider adoption of this feature set might increase the LTV for your wider customer base.
As before, using the method described above, add feature usage related attributes to your customers. For example, Twitter might add the attributes ‘number of times tweeted’ (integer) and ‘heavy user of direct messages’ (boolean) to their users.
To see if feature usage is associated with a higher LTV, follow these steps:
- In ChartMogul go to your LTV chart
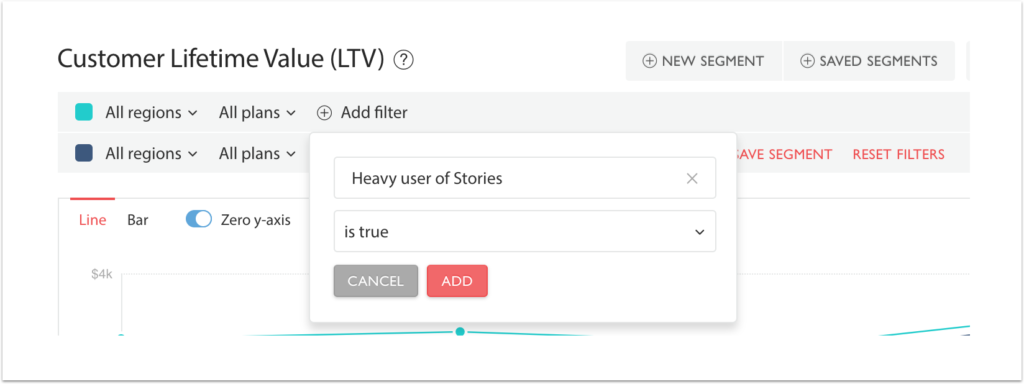
- Click Add filter and select (e.g.) Number of times used stories > greater than > 10
- Click New segment and then click Add filter and select (e.g.) Number of times used stories > equal to or less than > 10
You can also define whether a customer is a heavy user of stories as a boolean (true/false) attribute.
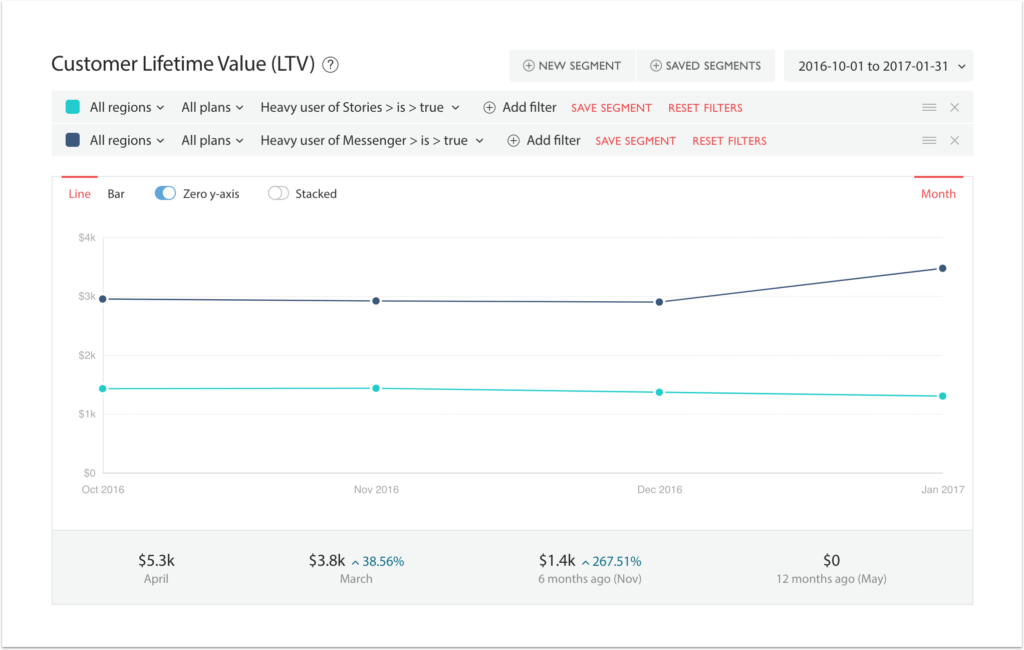
In the example below we can see that customers that are heavy users of the Messenger feature have a higher LTV than customers who use the Stories feature. By driving for a higher feature adoption of the Messenger feature, it’s possible that the LTV for your entire customer base would increase.
What we learned
In the examples above, we’ve seen that:
- Leads who invited other team members into our product are far more likely to convert to paid customers.
- Customers who heavily use our “Messenger” feature have a higher LTV than customers who use the “Stories” feature.
Both of these insights can clearly contribute towards decisions around the product — particularly the onboarding experience and adoption of specific features.
Next steps
Now that we’ve built segments based around product usage, there’s a wealth insights waiting to be discovered. It could be incredibly useful to look at:
- The impact on churn rate generated by the adoption of a new feature
- A cohort analysis showing the retention over time of “power” users compared to other users.
- The MRR of customers who are not engaged with the product (and are therefore at risk of churn)
As soon as you’re sending detailed product usage data to ChartMogul, all of the above analyses are quick and simple to achieve.
Share your analysis
Do you have a particular analysis in ChartMogul that has helped gain unique insights? Do you think it could help other users? Please send it to us at support@chartmogul.com.