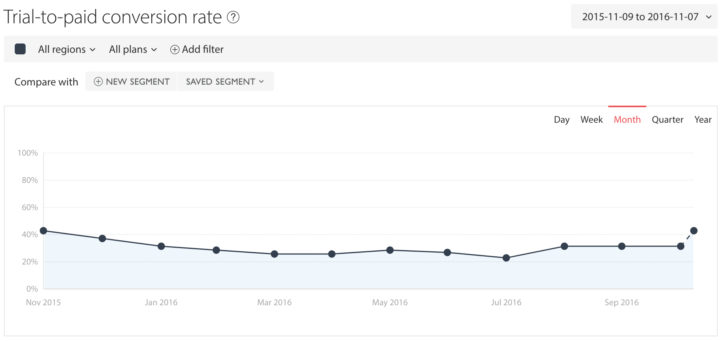
Over a year ago, I wrote a blog post about making trial-to-paid conversion rates meaningful using cohorts. Since publishing the post many of our customers emailed in asking when they’ll be able to do this analysis in ChartMogul. I’m excited to announce that it’s now possible to track trial-to-paid conversion rates, plus a bunch more trial and lead related metrics, within ChartMogul.
What’s new?
You’re going to see four new graphs when you log in.

Analyzing leads and trials with Segmentation
One of the most exciting things about this feature is that all these new charts also work with ChartMogul Segmentation. This means customers on the MOGUL plan can pipe in relevant attributes, such as onboarding or marketing data, and then ask questions such as:
- What’s our conversion rate to paid for accounts that fully onboard during their trial vs. those that don’t?
- Which marketing channels produce the leads most likely to convert to customers?

New filters for leads and trials
There are also three new filter attributes available:
- Lead started at – The time at which a lead was created.
- Trial started at – The time at which a free trial was started.
- Trial-to-paid in days – The number of days from the “Trial started at” time to the “Customer since” date.
“Trial-to-paid in days” is a special attribute that gives you the power to make the Trial-to-paid conversion rate graph more meaningful. The method involves measuring the % of trials that convert into paid subscribers within a defined number of days. One useful analysis is to compare your 30-day trial-to-paid conversion rate against your 90-day trial-to-paid conversion rate to see what % of trials are converting long after a typical SaaS free trial has expired. If you’re a ChartMogul customer, learn more about this here.

With the “Trial-to-paid in days” attribute, you can also find out if customers who took a long time to buy have a higher or lower churn rate.
One way that we’re using this new feature
At ChartMogul one of the things we like to track is the number of onboarded trials we get each month (in our case we see if there are any active subscribers uploaded to an account). Then we look at the trial-to-paid conversion rates for onboarded vs non-onboarded trials.
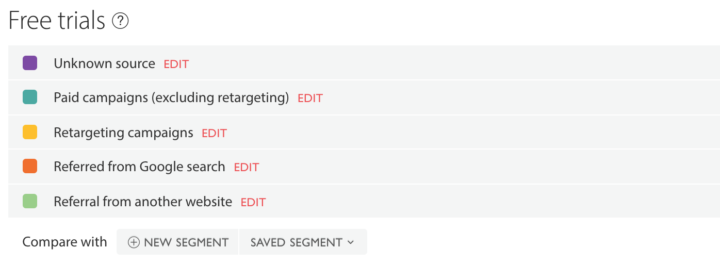
Using the Enrichment API, we add custom attributes about onboarding and lead source to the trial records in our ChartMogul account. We then use these attributes to segment our Free trials and Trial-to-paid conversion rate graphs.

Previously, to do the calculations and chart building, we were running reports in Intercom once a month and then copy/pasting the values into an Excel file. Now we track everything in real time directly in ChartMogul.
Getting started
We really hope you’re as excited about this new feature as we are. If you don’t use the trial features of Stripe, Braintree, Recurly or Chargify, setting up lead and trial tracking in ChartMogul requires a small amount of integration work using our API. Please start by reading this tutorial.
